
SI TriMesh™ — Instruction Manual #
Version 1.2 — written against bridge firmware v1.2
Verified against a live bridge running firmware v1.2.
1. About This Manual #
This manual covers the SI TriMesh™ IP Bridge, the hub that connects motorized shades and other devices to your local network so they can be set up, controlled, and integrated with control systems.
Who this is for: dealers and professional installers. No programming knowledge is required for anything in the main body of this manual. The appendix on the local API is intended for integrators and is more technical.
A note on the two view modes: the bridge’s web interface has a Simple view and an Advanced view (a toggle at the top of the left menu). Simple view shows everyday controls. Advanced view adds installer and diagnostic tools. Throughout this manual, anything that requires Advanced view is marked (Advanced view). If you cannot find a button described here, check that you are in Advanced view.
If you are standing at a job and want the short version, use the companion SI TriMesh Quick Start Guide. It is the same installation in numbered steps with no reference material in the way. This manual is what you open when the Quick Start Guide sends you here, or when you need to know what a screen does rather than what to press next.
Which firmware this matches. Everything here was checked against bridge firmware v1.2, build line v1.2 (2026-09-17). Your bridge shows its version in two places: that build line at the bottom of the left menu, and the top-right corner of any exported Install Report. A later build date on the same version is normal; if the version itself differs, expect small wording differences on screen.
2. Product Overview #
The TriMesh IP Bridge is the translator between your network and the motors. You talk to the bridge from any web browser; the bridge talks to the devices over whichever connection they use. It presents every device — regardless of how it is connected — as one simple list with the same controls.
The bridge handles four device families at the same time:
Protocol | What it covers | How devices connect |
|---|---|---|
SI IP | SI IP-native devices | Directly over your local network |
Synergy | Synergy devices | Directly over your local network |
SDN | Wired SDN motors — not in the initial release; wired motors are handled by the TRO.Y at launch | RS485 wired bus |
Zigbee | Zigbee motors, plugs, lights, remotes, and sensors | Wireless mesh through up to three Zigbee coordinators |
Think of a Zigbee coordinator as the antenna for one wireless neighborhood of devices. Most homes need only one; the bridge supports up to three for very large installations, and each one runs its own mesh network.
The bridge also exposes connected shades to TRO.Y by giving each one a virtual SDN address, so an existing TRO.Y-based control setup can drive Zigbee shades through the bridge.
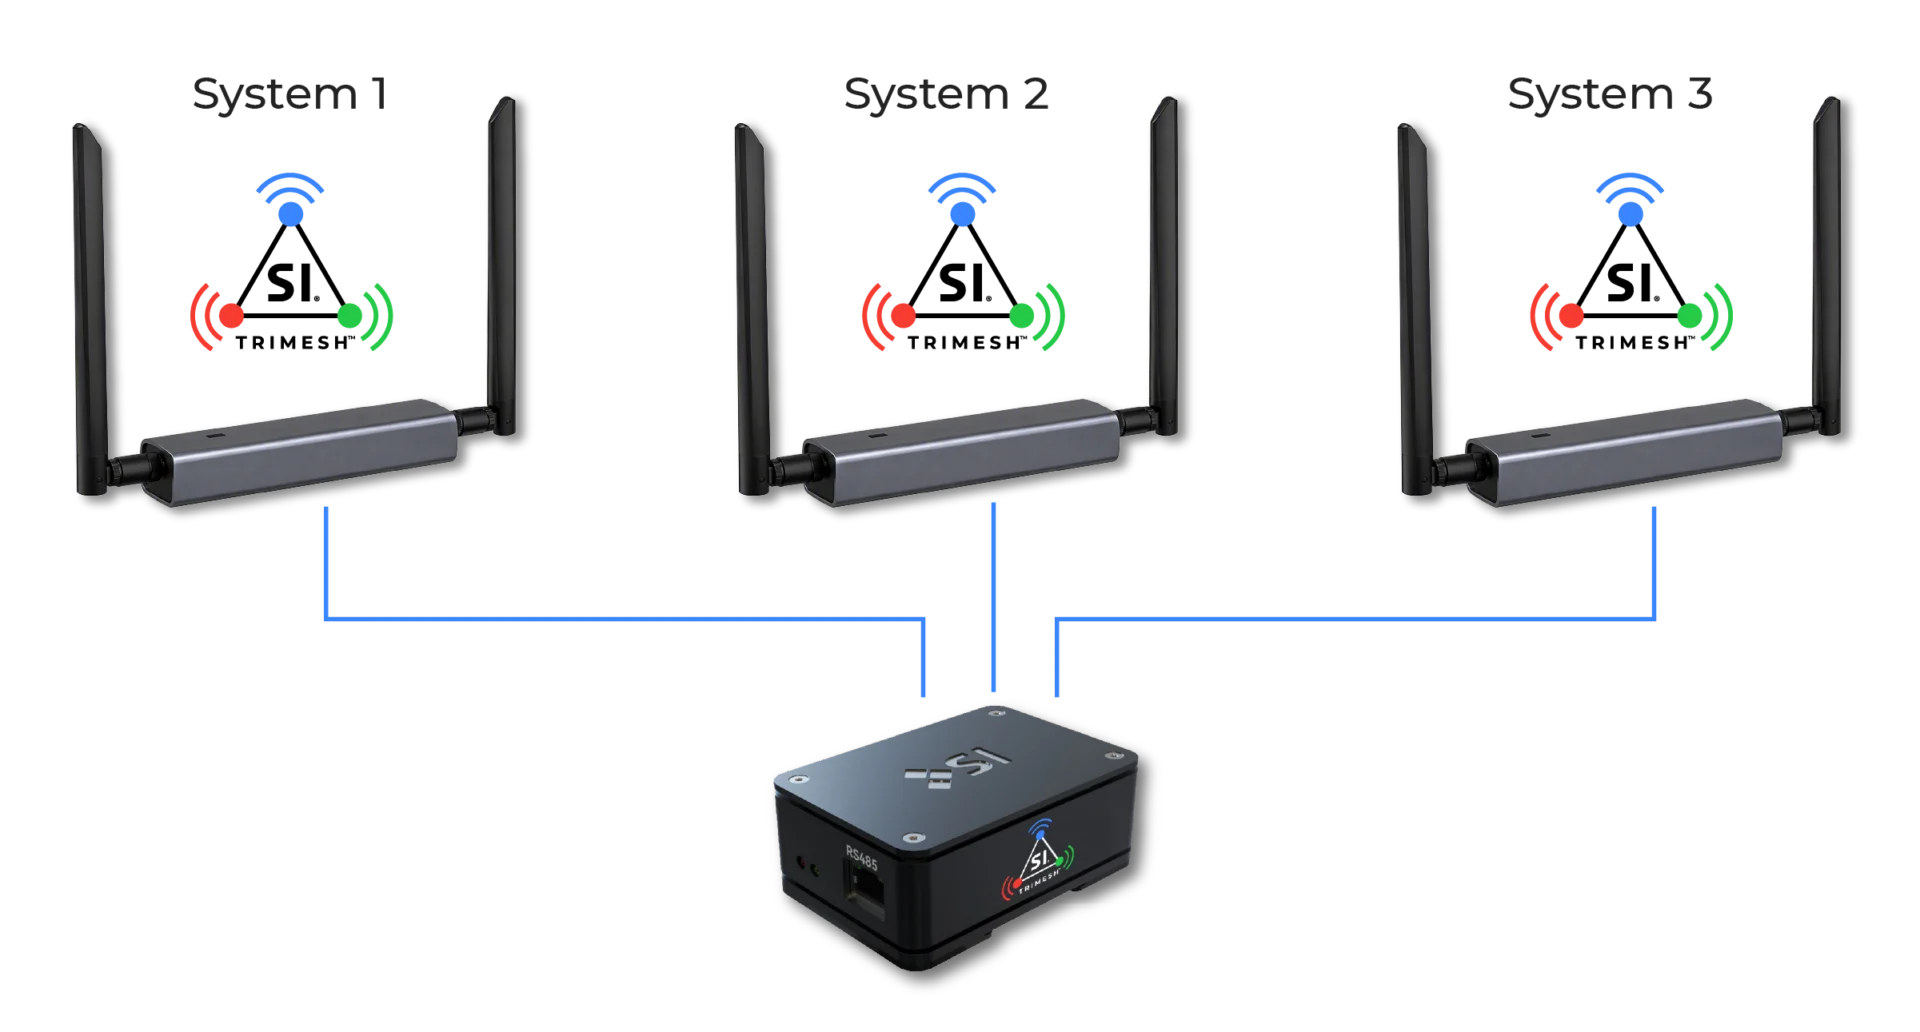
One bridge, up to three Zigbee coordinators — each running its own separate wireless network.
2.1 What’s in the Box #
TriMesh Bridge, PoE injector, Ethernet cable, Zigbee coordinator (one or more), and a QR code card.
2.2 Physical Features #
Ethernet port (PoE) — the single network cable is also the bridge’s power; there is no power brick.
RS485 port — the connection to a TRO.Y, carrying 485 and RTS devices and some third-party integrations.
B button — holding it for 4 seconds resets the web interface password (see section 12.3). #
3. Mounting and Connections #
The TriMesh Bridge can be mounted on a DIN rail, in a rack, or in a structured wiring panel.
Connect the bridge to a PoE port (or through a PoE injector) on the same network (same router) as the devices and computers that will talk to it. That one cable carries both network and power.
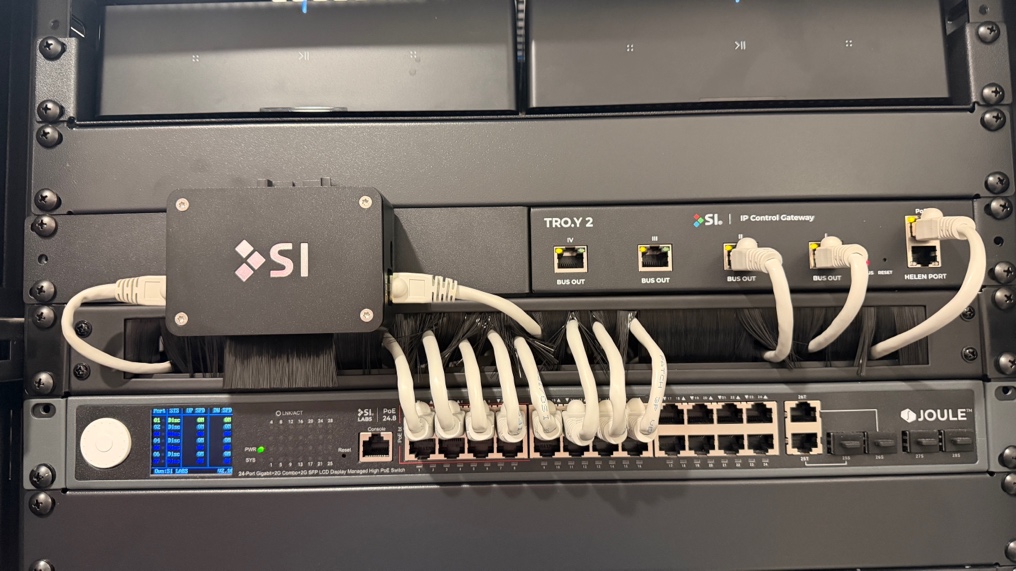
A TriMesh bridge installed in a rack alongside a TRO.Y 2 and the PoE switch that powers it.
4. First-Time Setup #
4.1 Find the Bridge on the Network #
Every bridge announces itself on the local network with a name based on its unit ID:
https://si-ip-bridge-XXXXXX.local
where XXXXXX is the six-character ID printed on the unit label. Typing that address into any browser on the same network opens the bridge. You can also use the bridge’s IP address (shown in your router’s client list) — for example https://192.168.1.42.
“Not Secure” in the address bar is expected here, and it is safe to continue. The bridge encrypts its pages with its own certificate rather than one bought from a public authority, so the browser flags it. Section 4.2 covers the two clicks that get you past it.

The address bar on a bridge page: “Not Secure”, with https struck through. Expected on a local device, and safe to continue.
4.2 About the Browser Security Warning #
The bridge encrypts its pages with its own certificate. Because that certificate is not from a public authority, browsers show a one-time notice such as “Your connection is not private”, usually with a code like NET::ERR_CERT_AUTHORITY_INVALID. This is normal for equipment on a local network that does not live on the public internet.
Getting past it takes two clicks: Advanced, then Proceed to <address> (unsafe). The screenshots below are Chrome on macOS; other browsers use different words (Safari says “Show Details” and “visit this website”, Firefox “Advanced” and “Accept the Risk and Continue”) but every one of them follows the same shape — expand the advanced section, then continue. Each new computer or phone sees it once.
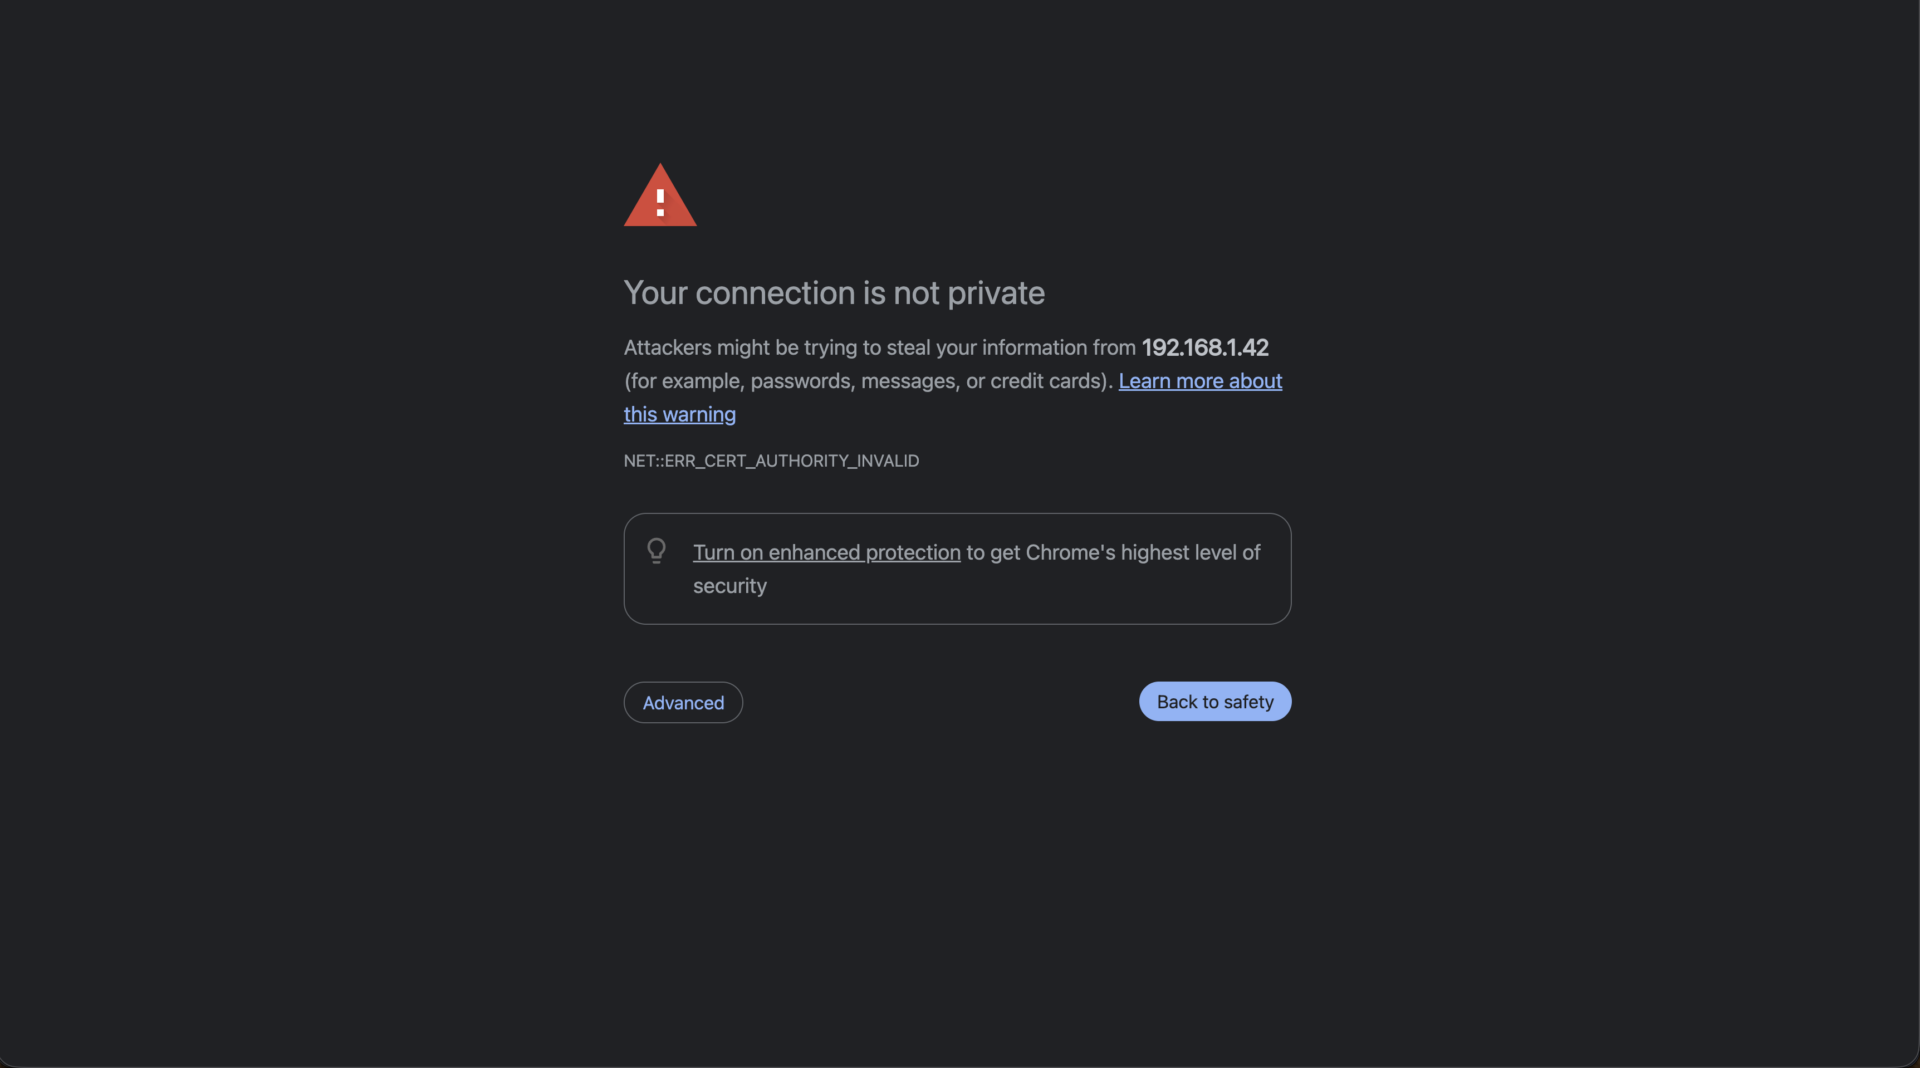
The notice as it first appears (Chrome on macOS) — the Advanced button is bottom left.
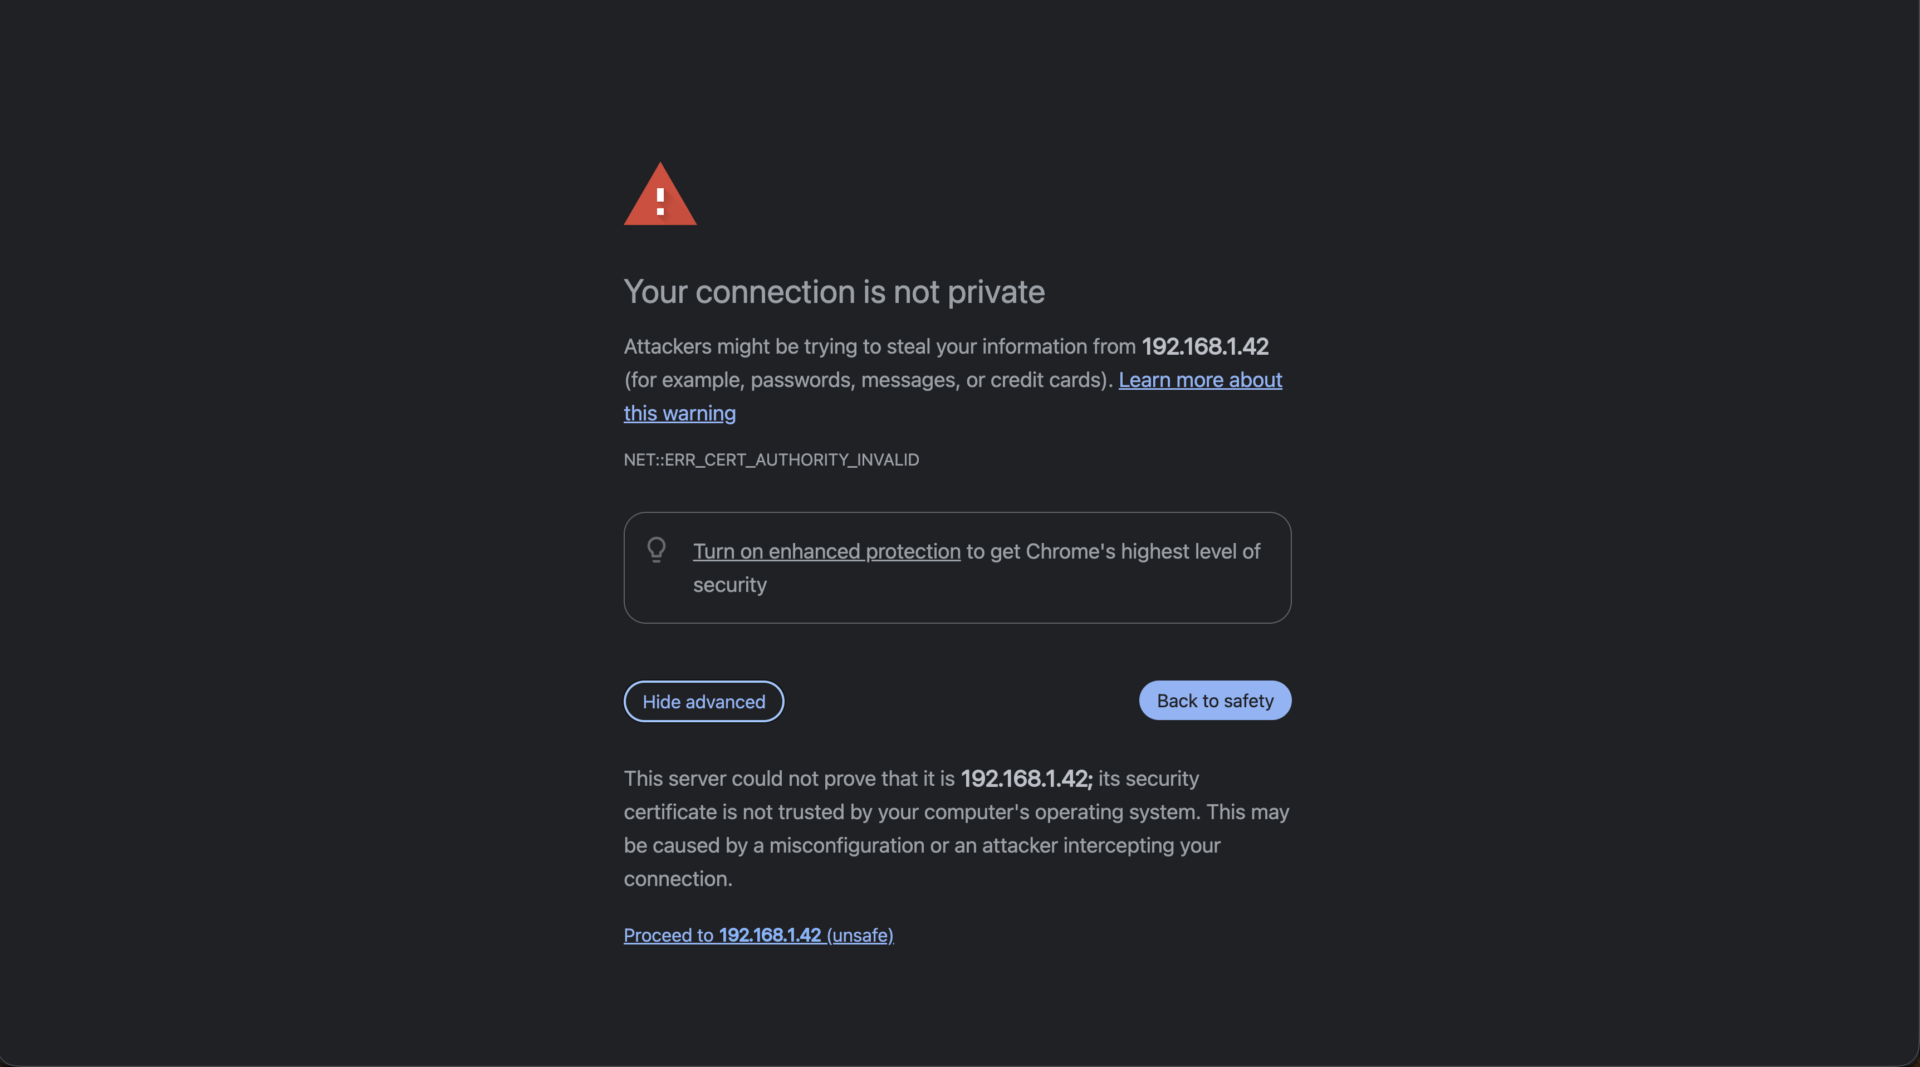
After Advanced, the Proceed to … (unsafe) link appears at the bottom.
4.3 Create the Admin Password #
On a brand-new bridge (or after a password reset), the browser lands on the account creation page where you set the web interface password (minimum 10 characters). This one password protects all bridge settings — treat it like the keys to the installation and record it in your project documentation.
Once a password exists, the account-creation page is no longer reachable; it only comes back after a password reset with the B button (section 12.3).
4.4 Log In #
The login page asks for the password only (there is no username). After logging in you arrive at the Dashboard.
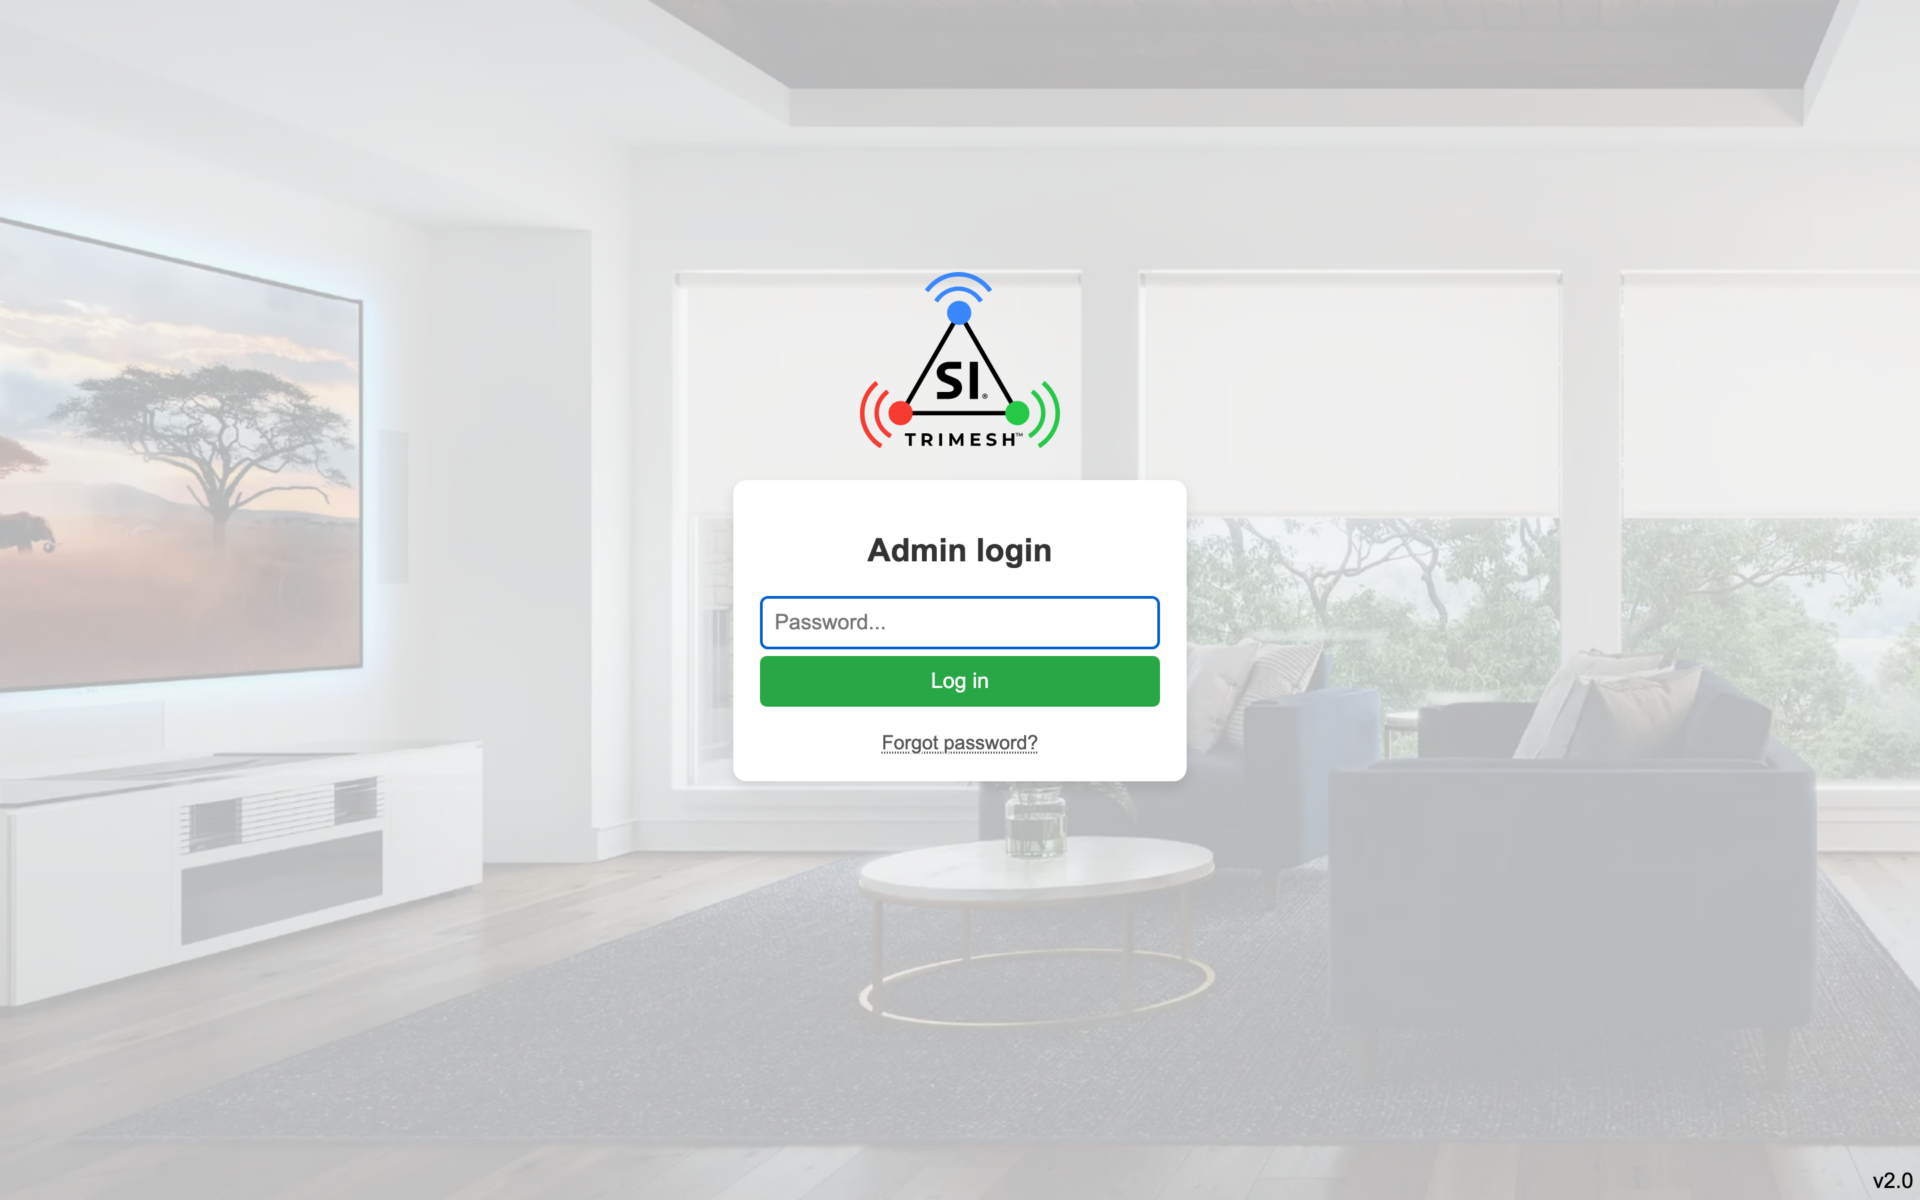
The login page.
Sessions are kept alive while you use the interface. After roughly two hours idle, a “Session expires soon due to inactivity” banner appears with a Stay logged in button.
A Forgot password? link on the login page reveals the password hint (if one was set) and the B-button reset instructions.
Logout is at the bottom of the left menu.
5. The Web Interface, Section by Section #
This is the heart of the bridge. Everything an installer does — commissioning, pairing, naming, grouping, scenes — happens here, not in the API.
5.1 Layout Basics #
A vertical menu (tab rail) runs down the left side with eight sections:
Dashboard · All devices · Rooms · Groups · Scenes · Discovery · Activity · Settings
Above the page content you will find:
View: Simple / Advanced — the master switch for installer tools. Your choice is remembered per browser.
Theme: System / Light / Dark — cosmetic preference.
Logout.
The bridge version is shown at the bottom of the menu as the version and its build date together — on the shipping firmware, v1.2 (2026-09-17). Quote that whole line when you report a problem; the version number on its own does not change between builds.
The full window in Advanced view. The left rail carries the View toggle, the theme selector and Logout.
5.2 Dashboard #
The Dashboard is a customizable home page. Out of the box it is empty; you build it from widgets.
Press Edit dashboard to open the widget editor.
Widget types: Device, Room, Group, Scene, and Bridge status. Each widget can be Compact, Medium, or Wide, with an optional custom title.
Favorites strip: devices, rooms, and groups all carry a star (“pin”) control in edit mode. Pinned items collect in a Favorites row at the top of the Dashboard — the fastest way to give a homeowner one screen with their most-used shades.
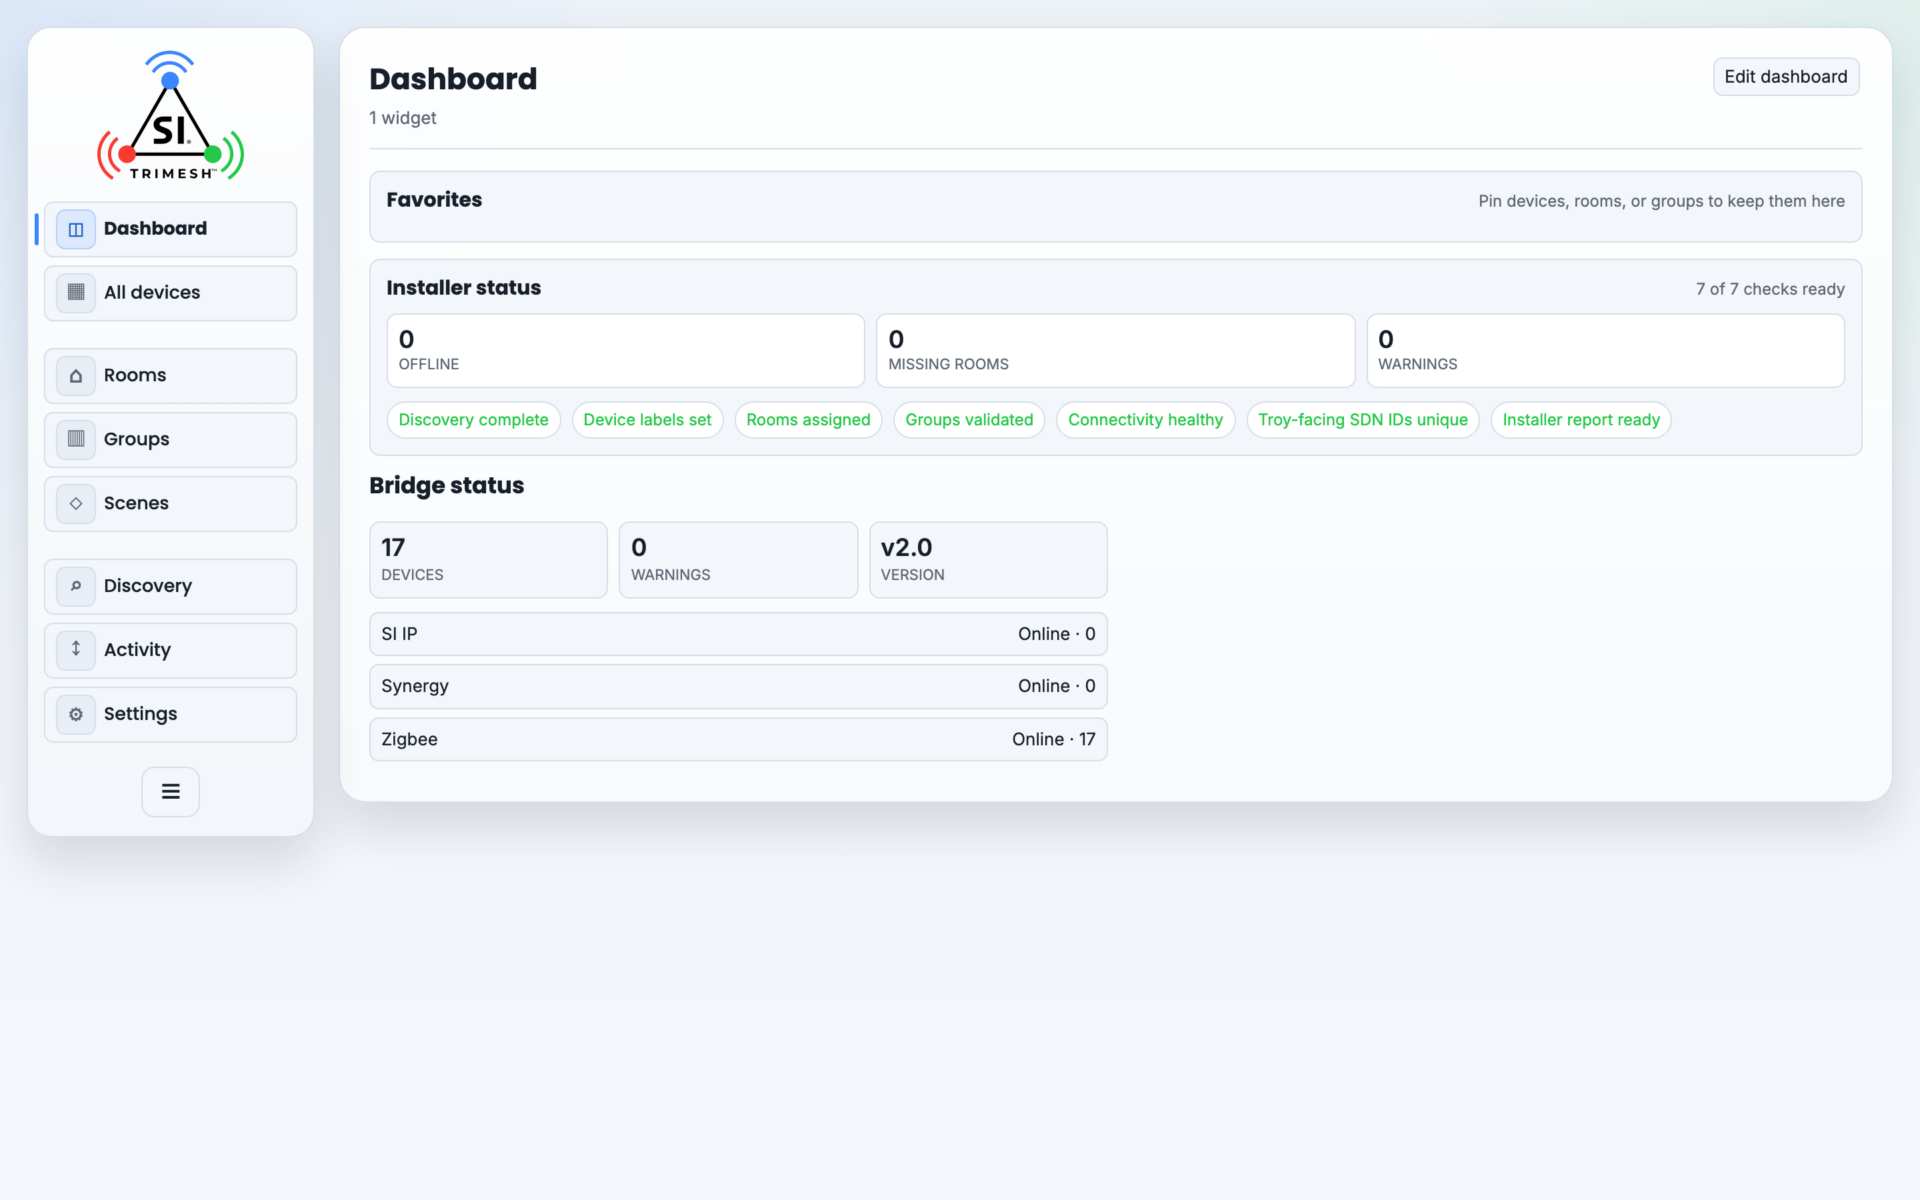
Installer status (Advanced view): a readiness checklist summarizing commissioning progress (“X of Y ready”). The checks are: Discovery complete, Device labels set, Rooms assigned, Groups validated, Connectivity healthy, Troy-facing SDN IDs unique, Installer report ready. The same chips appear at the bottom of the Settings page.
A Bridge status widget is a good permanent addition: it shows at a glance whether the bridge and its protocols are healthy.
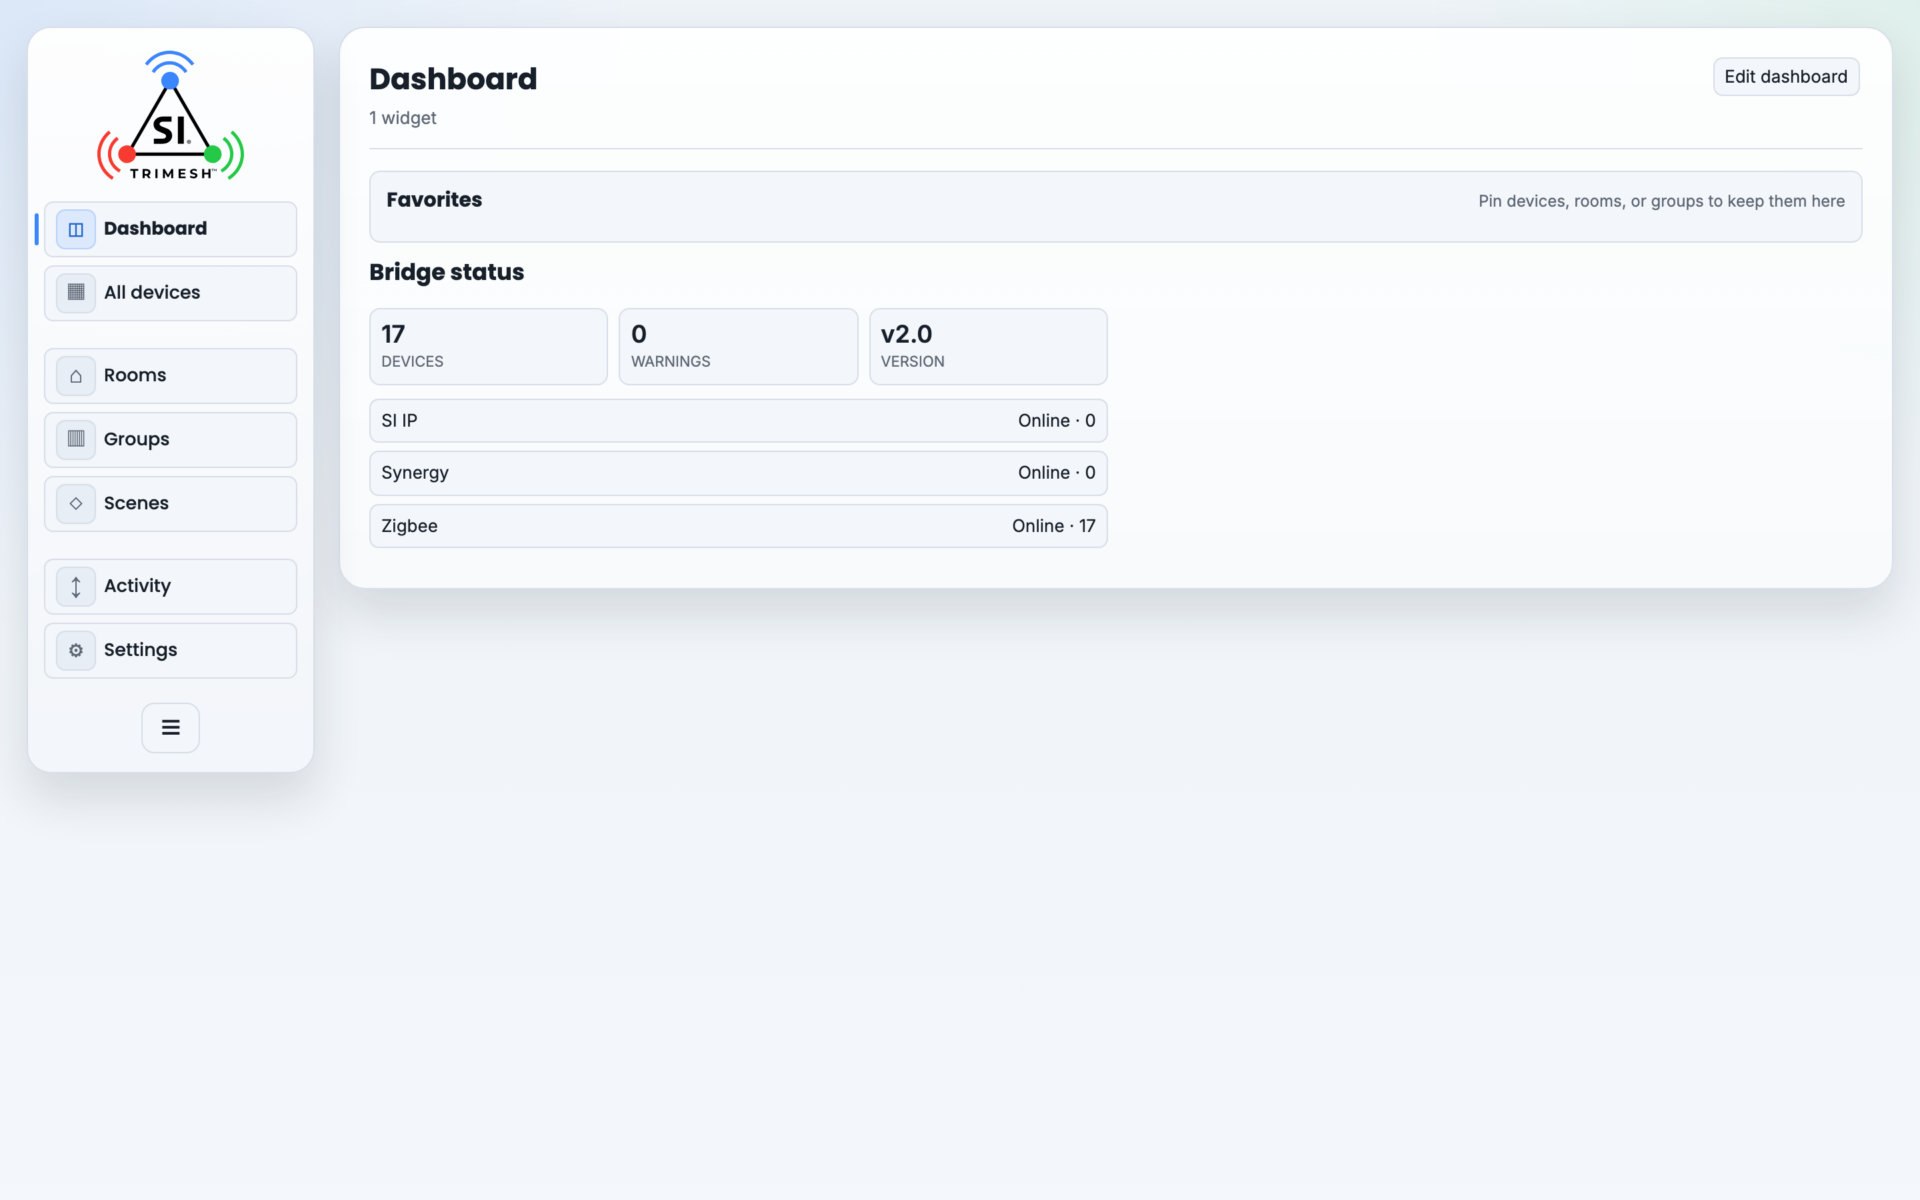
The Dashboard, with pinned favorites, shade and room widgets, a scene tile and bridge status.
5.3 All Devices #
A tile grid of every device the bridge knows about, whatever protocol it uses.
Search box — filters by label, type, room, or protocol as you type.
Type filter row — one-tap filters (motors, switches, lights, sensors…).
Each tile shows the device’s name, room, and current state (for shades, the position), with quick controls right on the tile.
Edit mode adds the favorite pins and rename controls.
Tapping a tile opens the device control panel — described fully in section 8.
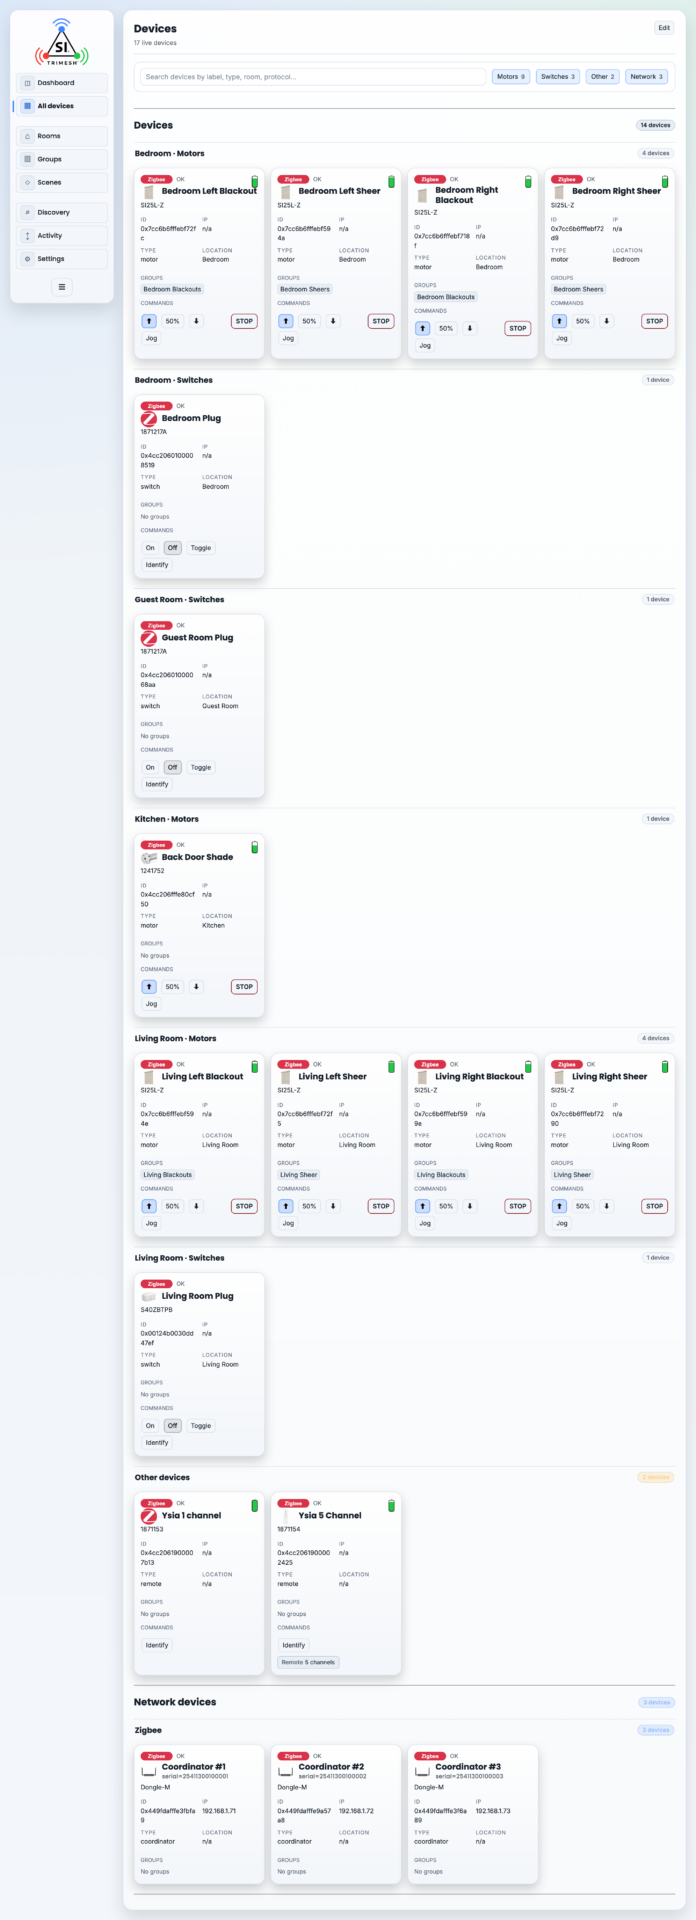
All devices: tiles grouped by room and type, with the search box and the Motors / Switches / Network filters along the top.
5.4 Rooms #
Rooms group devices by physical location, and they power room-level quick actions.
Create new room — name it (e.g., “Kitchen”). A device can be assigned from the Device / Room picker at the top of the page: choose the device, choose (or type) the room, press Assign room.
Devices can also be dragged between rooms in Edit mode. Removing a device from a room moves it to Unassigned.
Deleting a room does not delete its devices — they become Unassigned.
Rooms can be reordered (Move room earlier / later) to control display order.
Each room card offers one-tap room commands, automatically matched to what the room contains: Move all shades up / to 50% / down, Stop all shades, Turn lights and switches on / off, Toggle all switches, Set all lights to 50%.
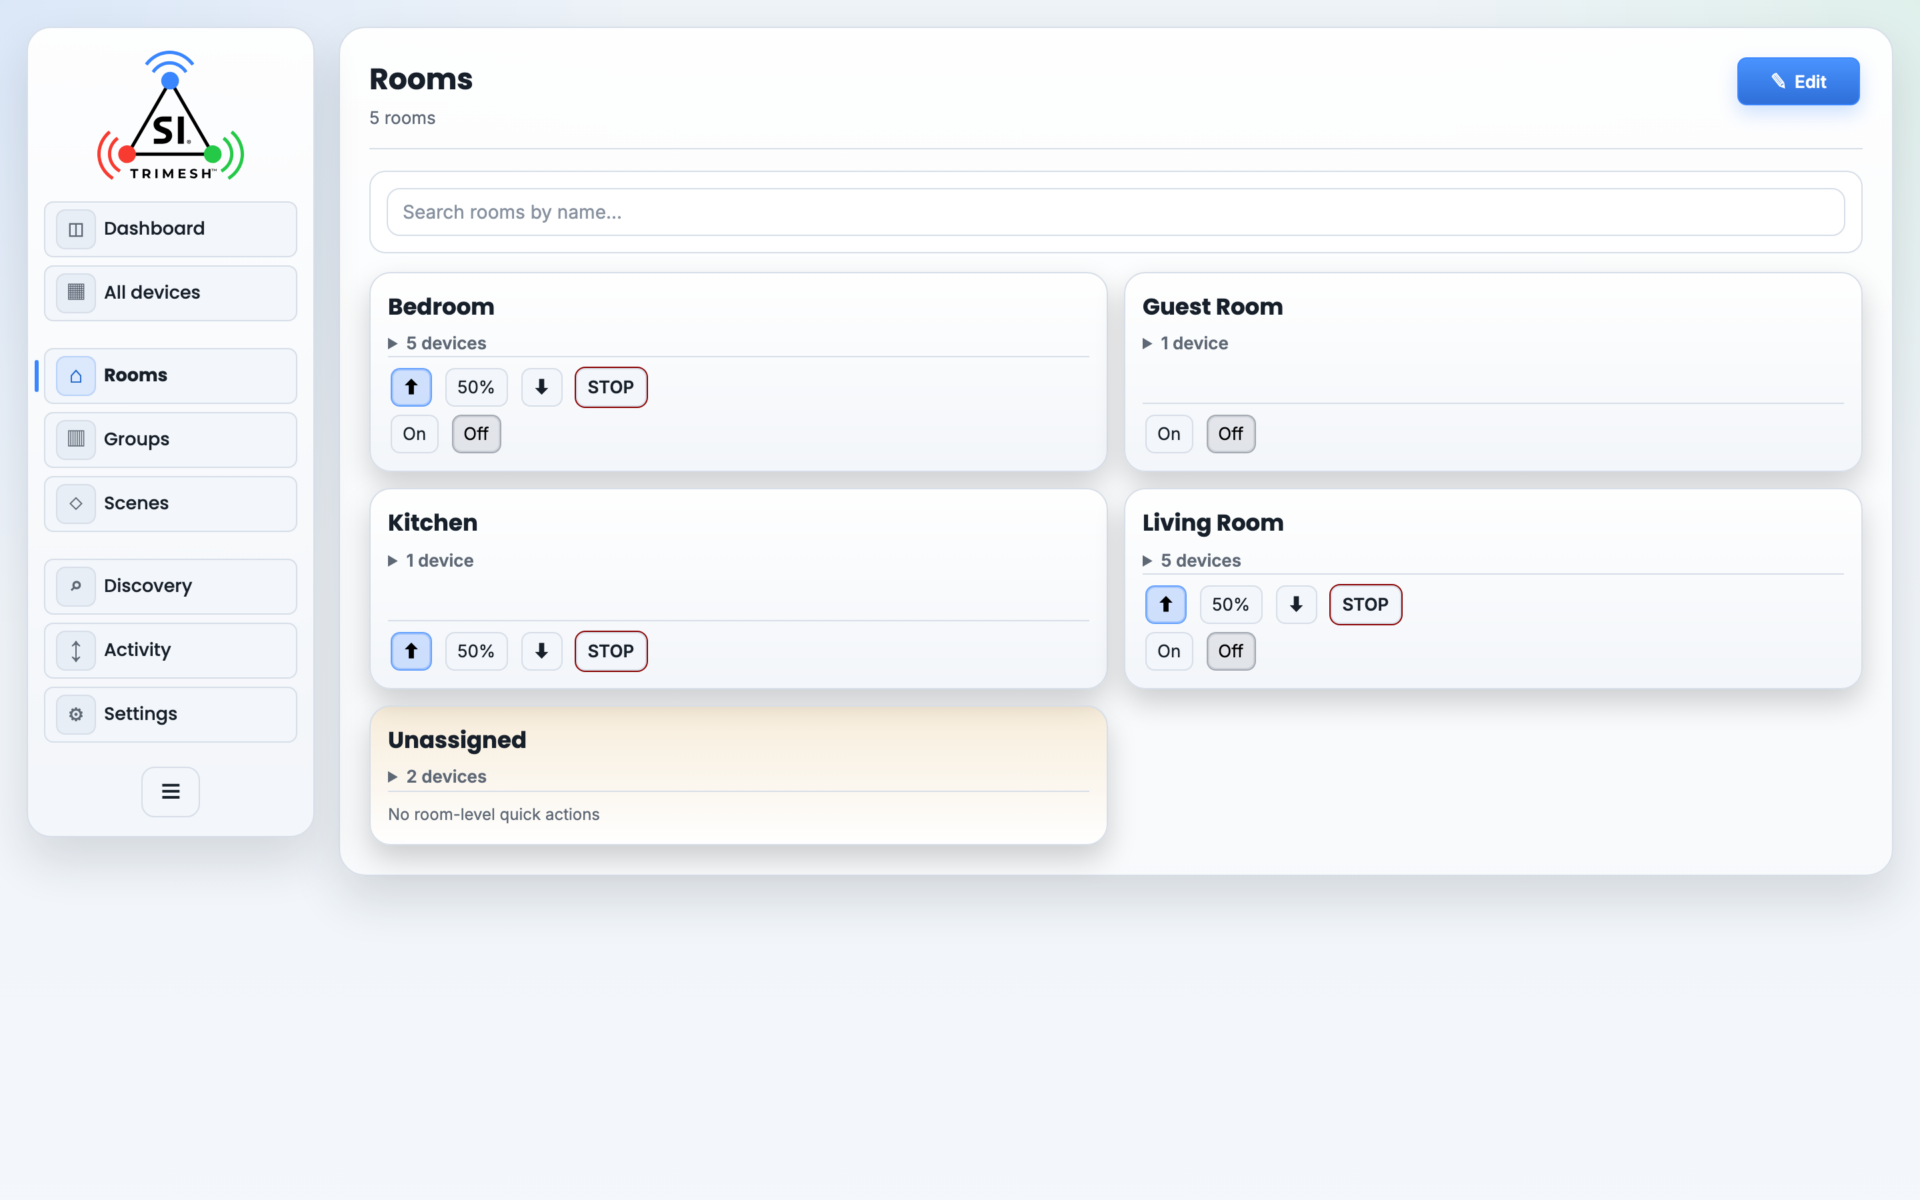
The Rooms page. Each room card carries its own quick actions, and the Device/Room picker at the top assigns devices.
5.5 Groups #
Groups are sets of devices that respond to a single command at the protocol level — a group command goes out once and all members act together, which keeps multi-shade movements perfectly synchronized. This is different from a Room (a display grouping) and from a Scene (a stored list of actions).
The Groups page lists every group discovered across all protocols, with member lists and one-tap group commands: Move group up / to 50% / down, Turn group on / off, Set group brightness to 50%.
Adding members uses a guided workflow (Edit mode → the group card walks you through choosing compatible devices).
Groups must contain one device type. If a group ends up with mixed types (e.g., a motor and a plug), the card shows a warning and asks you to remove mismatched members before using it.
For some protocols membership is managed elsewhere and is read-only here.
Creating, renaming, and deleting Zigbee groups lives in Settings → Zigbee Management → Groups (section 9.4). On the release build the Groups page no longer carries an “Open Zigbee groups” shortcut — reach that tab through Settings.
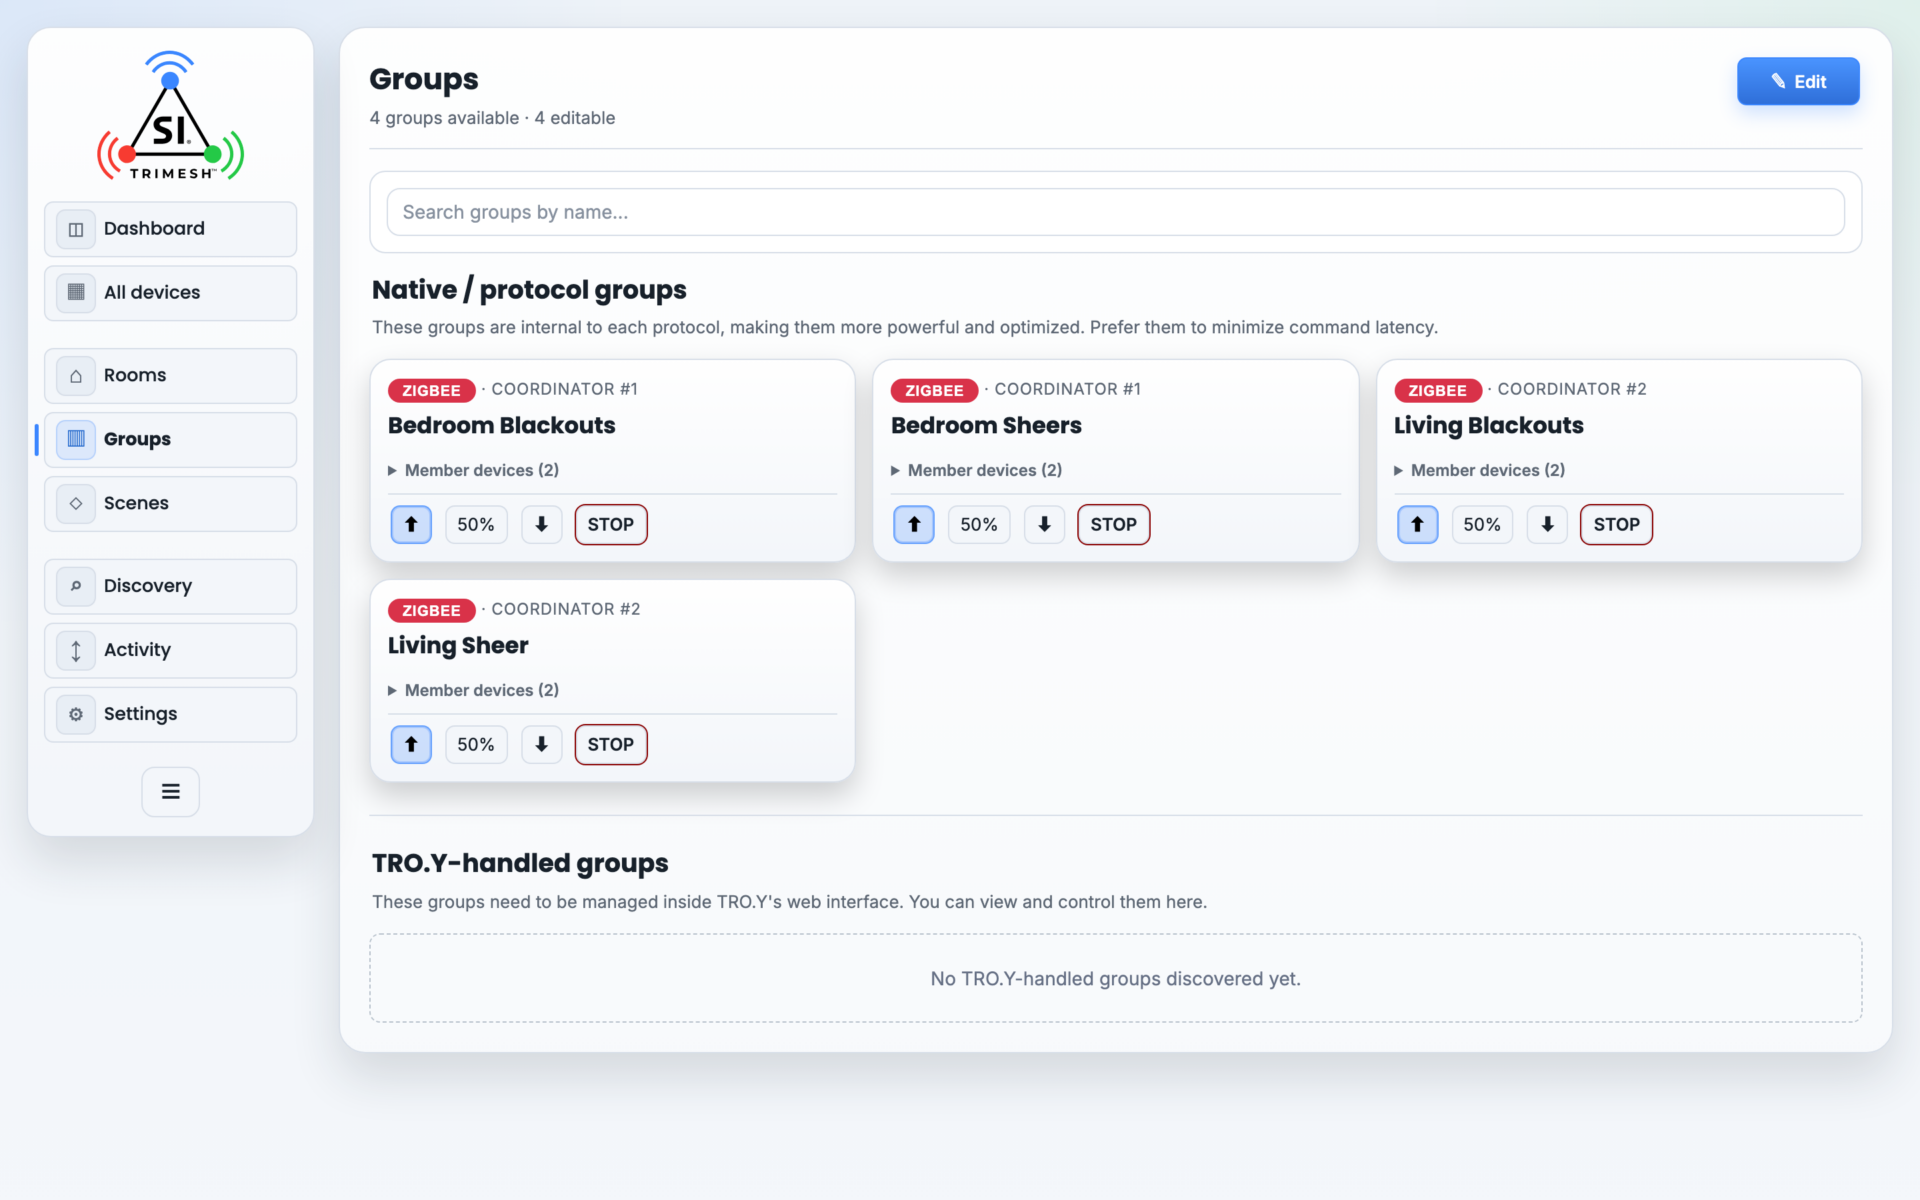
The Groups page, with each group’s members and its command buttons.
5.6 Scenes #
A scene is a saved set of actions that runs from one tile — “Movie,” “Good Morning,” “Away.” Scenes are stored and run on the bridge itself, so they work even when no app or control system is connected.
Creating a scene: press New scene, then in the editor:
Name it, and pick an icon (Scene, Open, Closed, Movie, Away) and color (Blue, Green, Red, Amber) for its tile.
Add actions. Each action has a target — All devices, one Device, a Room, or a Group — plus a device type (Motors, Switches, or Lights) and the command to run (move to a position, on/off, brightness, etc.). Add as many actions as needed; the scene lists them in order.
Press Save scene. It appears as a tile on the Scenes page (and can be added to the Dashboard).
Triggers — making scenes run automatically. Each scene can also fire on its own:
Device trigger — a Zigbee remote button-press or a sensor reading starts the scene. For sensor values you choose a condition (Above / Below / At least / At most) and a threshold — e.g., run “Shades Down” when illuminance is above 20,000.
Schedule trigger — at a set time, on chosen days of the week.
Sunrise / sunset trigger — at sunrise or sunset, with an optional offset in minutes (e.g., 30 minutes before sunset).
Schedule and sun triggers need the bridge to know where it is and what time zone it is in: the editor prompts for Time & Location setup the first time (see section 5.9 — it is a one-time entry of time zone, latitude, and longitude).
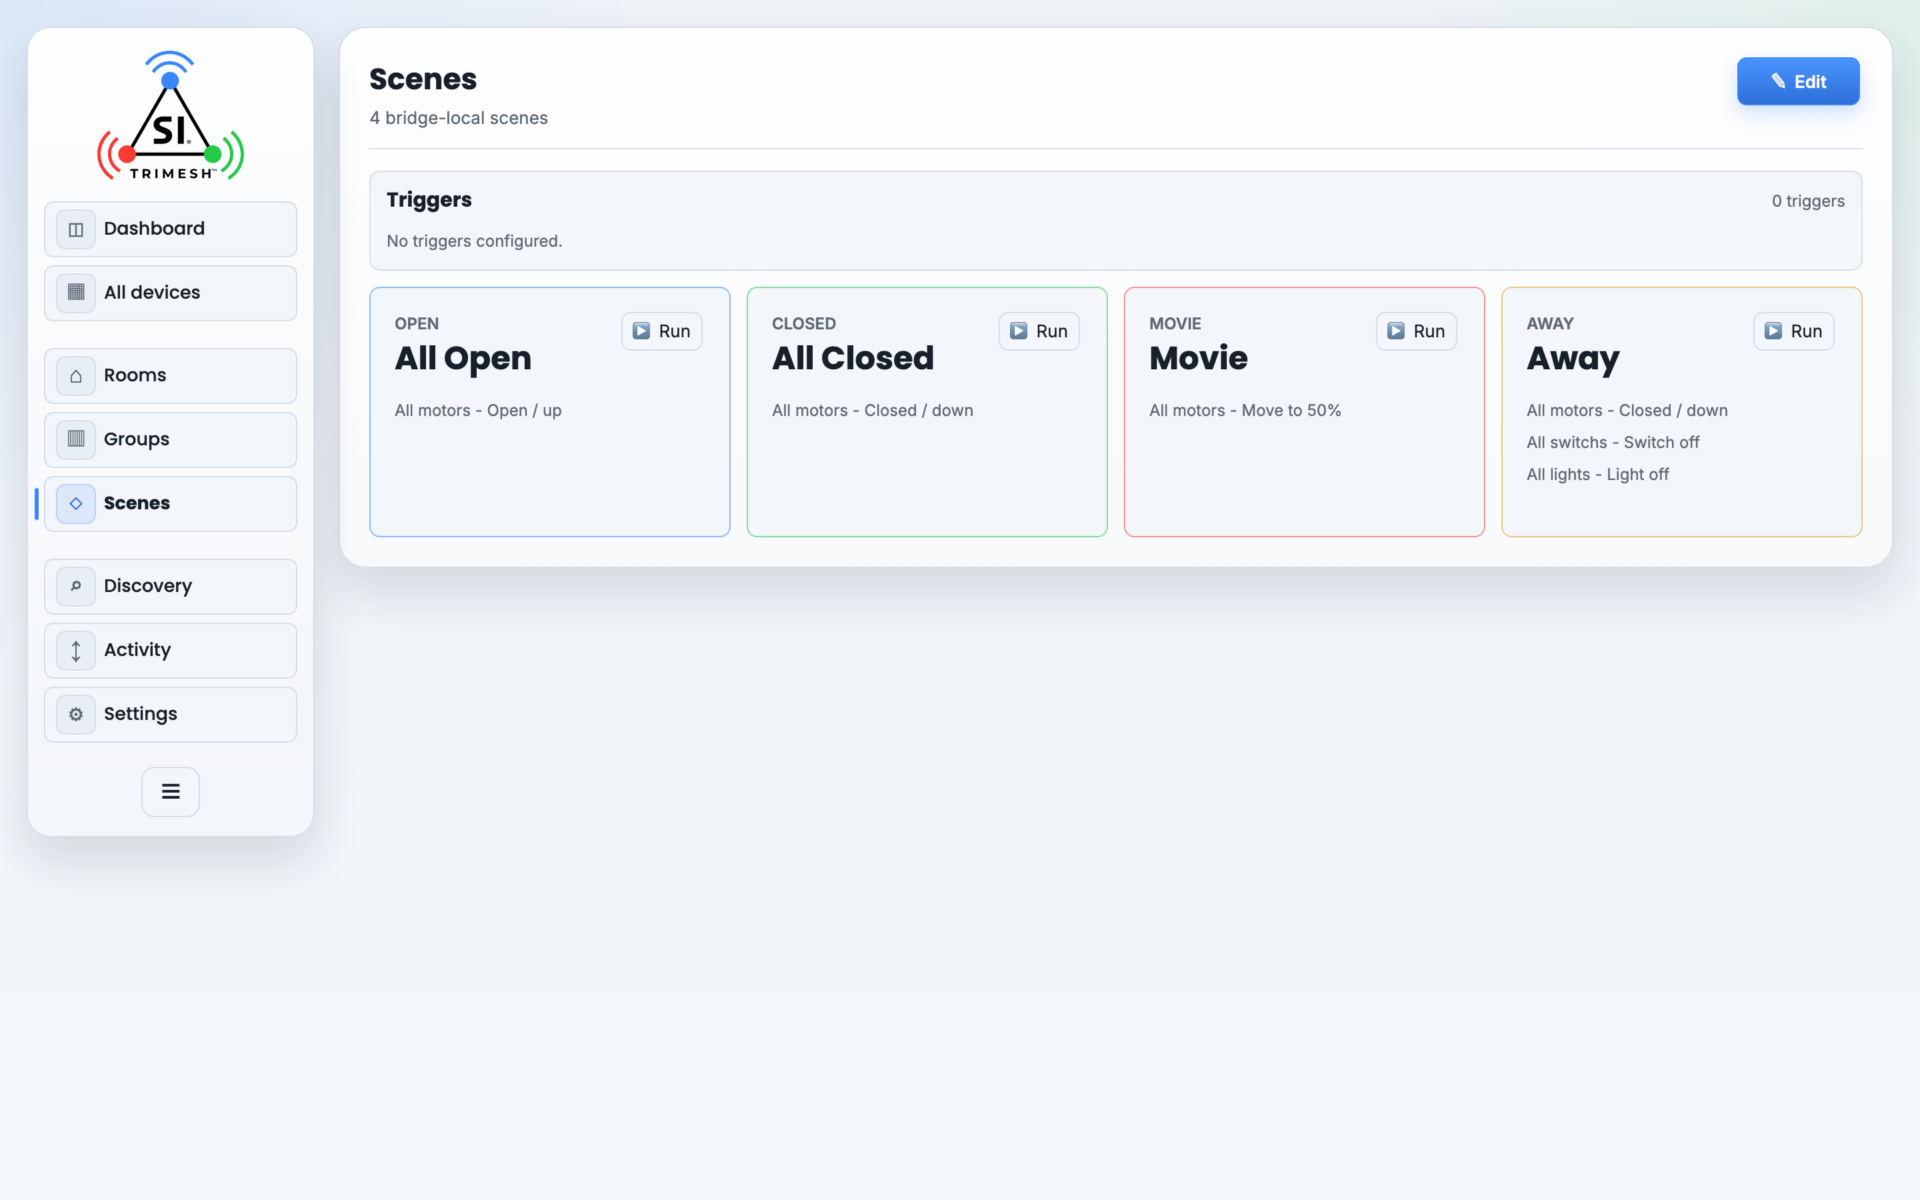
The Scenes page.
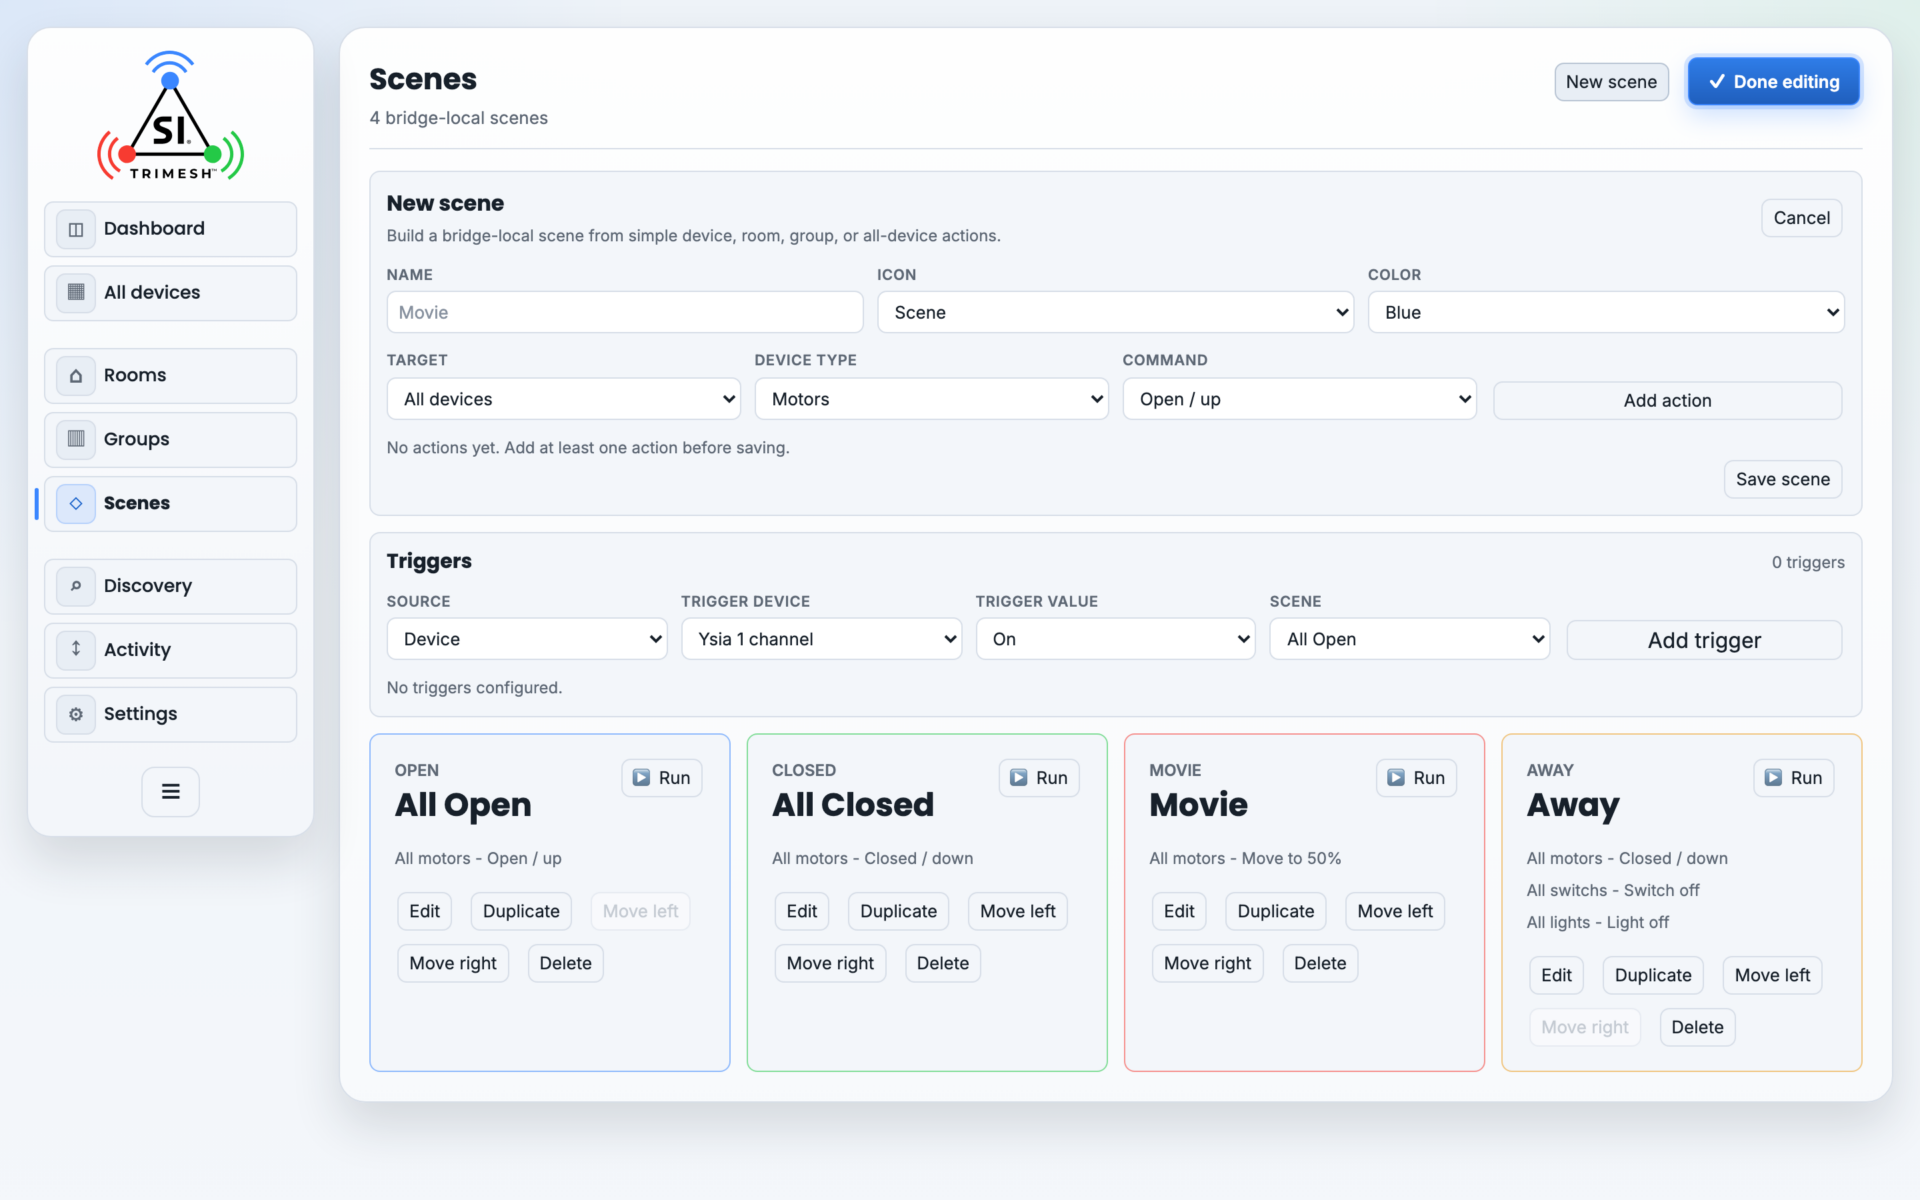
The scene editor: name, icon and colour, the action builder, and the Triggers panel.
5.7 Discovery #
Discovery is the installer’s live device table — denser than the tile view and built for commissioning work. On the release build the page is titled Discovery / Pairing and carries the Zigbee pairing controls at the top: a coordinator picker whose options read Coordinator #1 · serial, an Open network for pairing button, and a live status button that reads Pairing closed or Coordinator #1 open · 2:58 remaining. The window length itself is set on Zigbee Management → Commissioning. (Advanced view only — the Discovery entry does not appear in the menu in Simple view.)
Protocol filter checkboxes: SI IP, Synergy, SDN, Zigbee.
A text filter for ID, label, protocol, or IP.
Sortable columns: IP address, Protocol, Device ID, Label (directly right of Device ID on the release build), Groups, Model, Type, SW version, and Last frame (when the bridge last heard from the device — the quickest way to spot a unit that is out of range or not answering). Zigbee devices are listed beneath their coordinator, and each motor shows its TRO.Y-facing address under its Device ID as
(SDN: FE0005).Newly joined devices are highlighted and counted at the top (“2 new devices found”); the highlights fade on their own and Clear highlights removes them by hand.
Identify — a per-device button that makes the physical device announce itself: shades give a short jog, plugs and lights blink. Use it to confirm which physical shade a table row belongs to before naming it.
Checkbox selection targets one or more devices for commands and for OTA firmware updates (section 9.3).
Re-launch discovery re-scans all protocols if something new was just powered on.
Zigbee devices are listed under their coordinator, and each row indicates whether it is currently reachable.
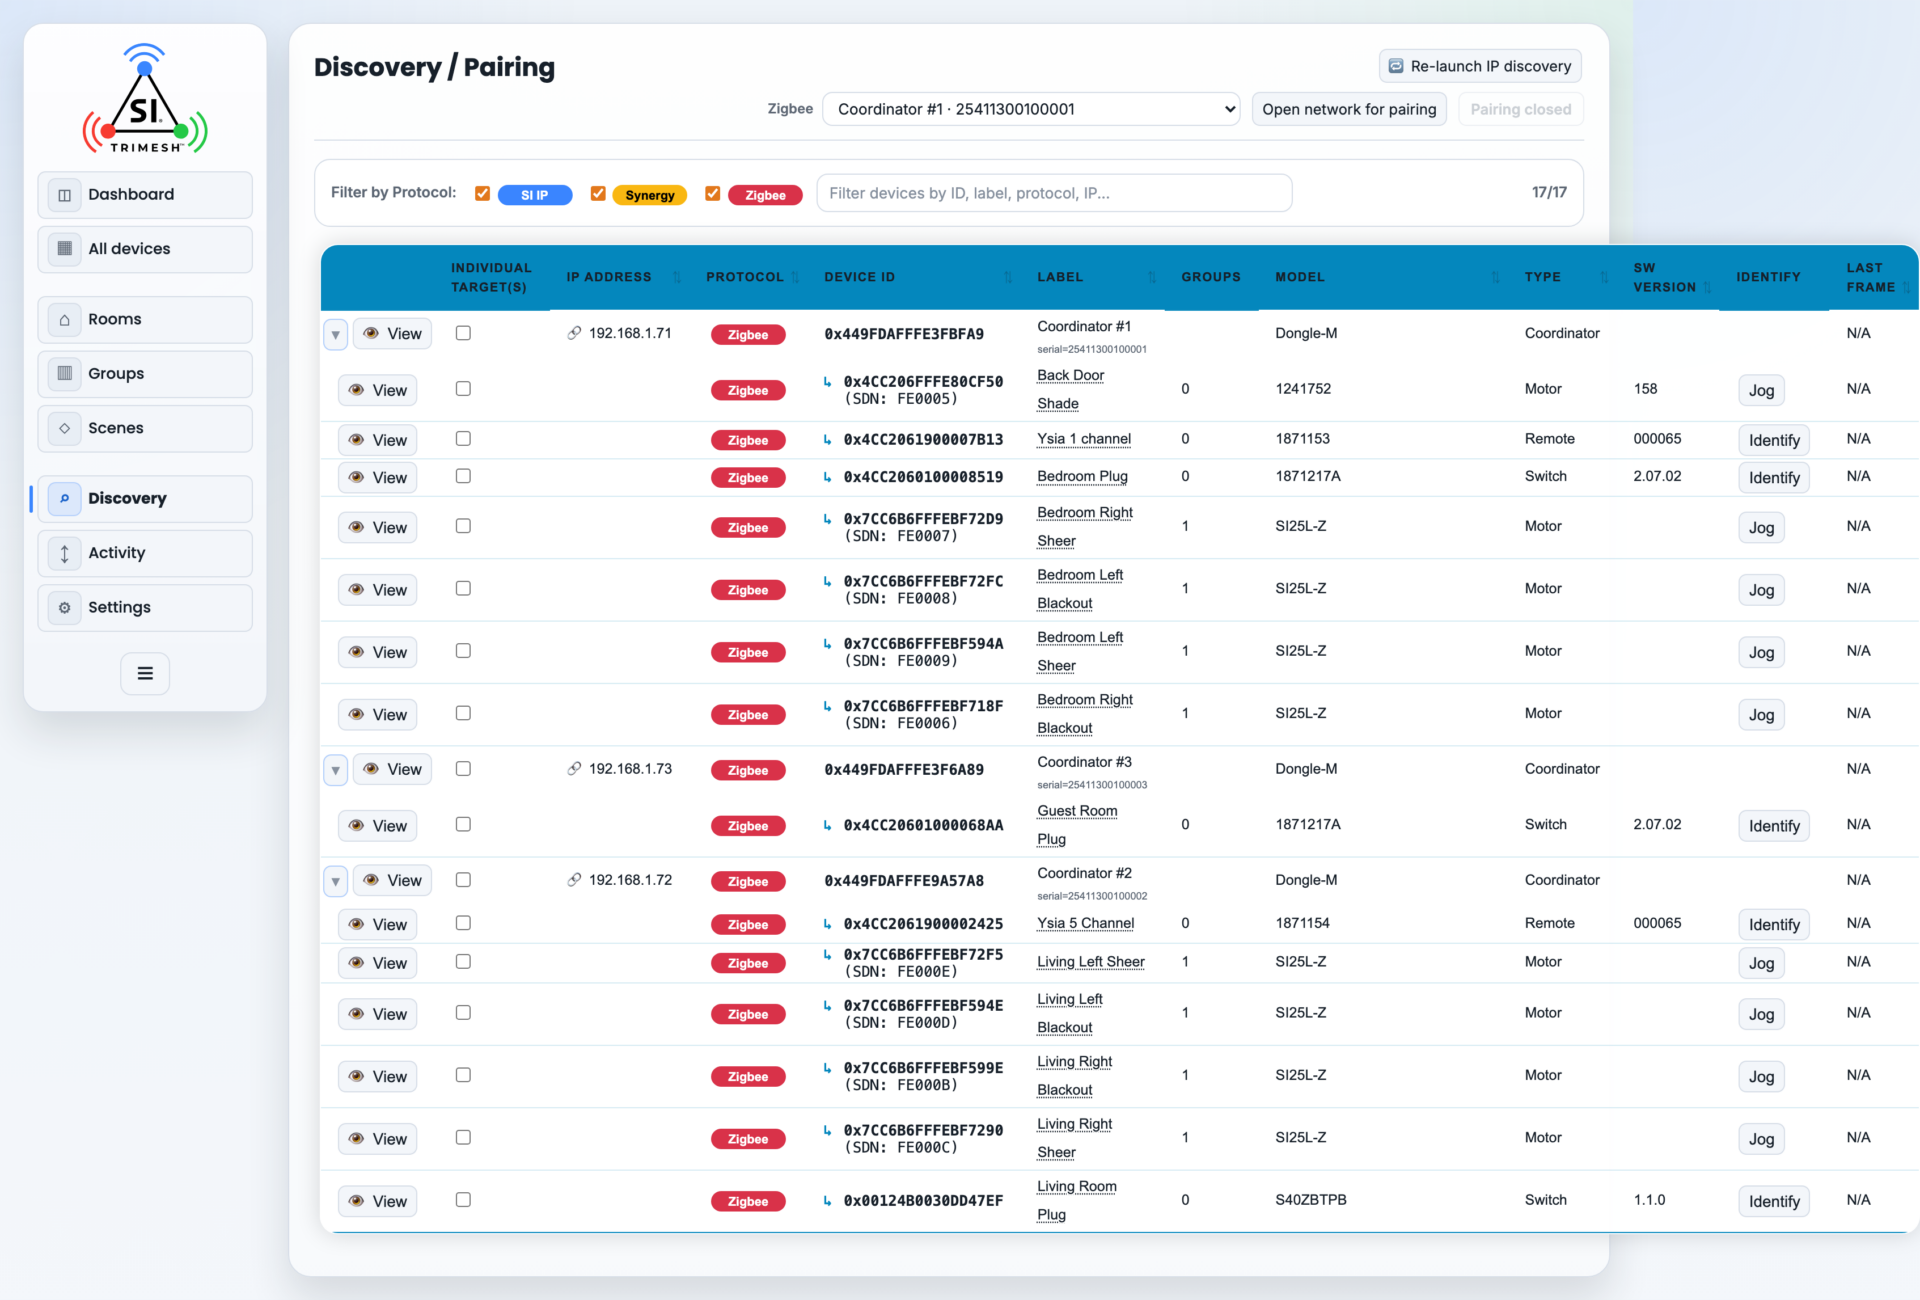
The Discovery table. The protocol filters sit at the top, and the Last frame column shows when each device was last heard from.
5.8 Activity #
A live log of everything crossing the bridge while the page is open: when, direction (command out / report in), device, action, and source. It holds up to 1,000 entries, with pause-autoscroll and clear controls.
Use it to answer “did the motor actually receive that command?” and “what is sending commands to this shade?” — invaluable when a control system and the bridge are both in play.
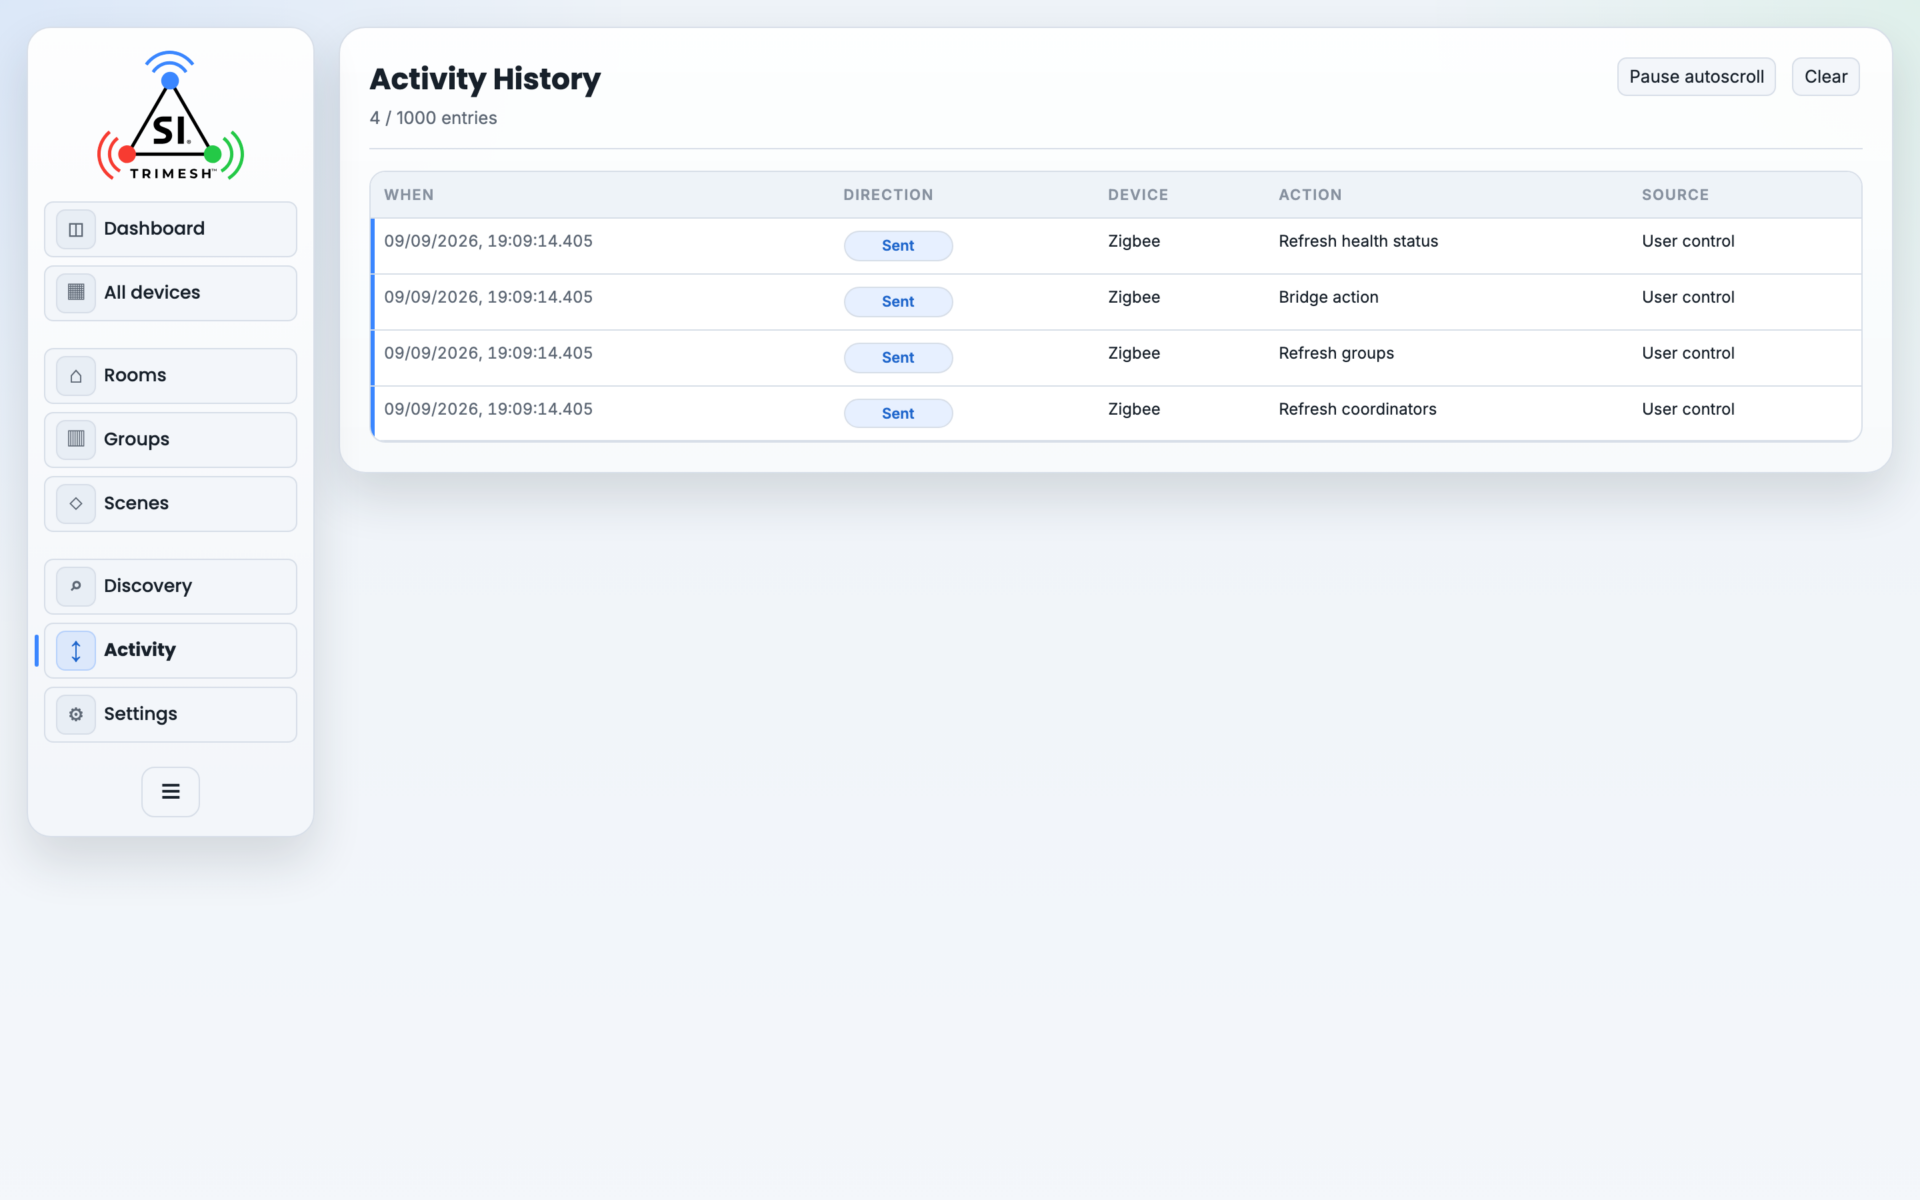
The Activity log, showing commands sent and the reports that came back.
5.9 Settings #
Settings is organized into cards. In Simple view only the everyday items show; Advanced view reveals the full set.
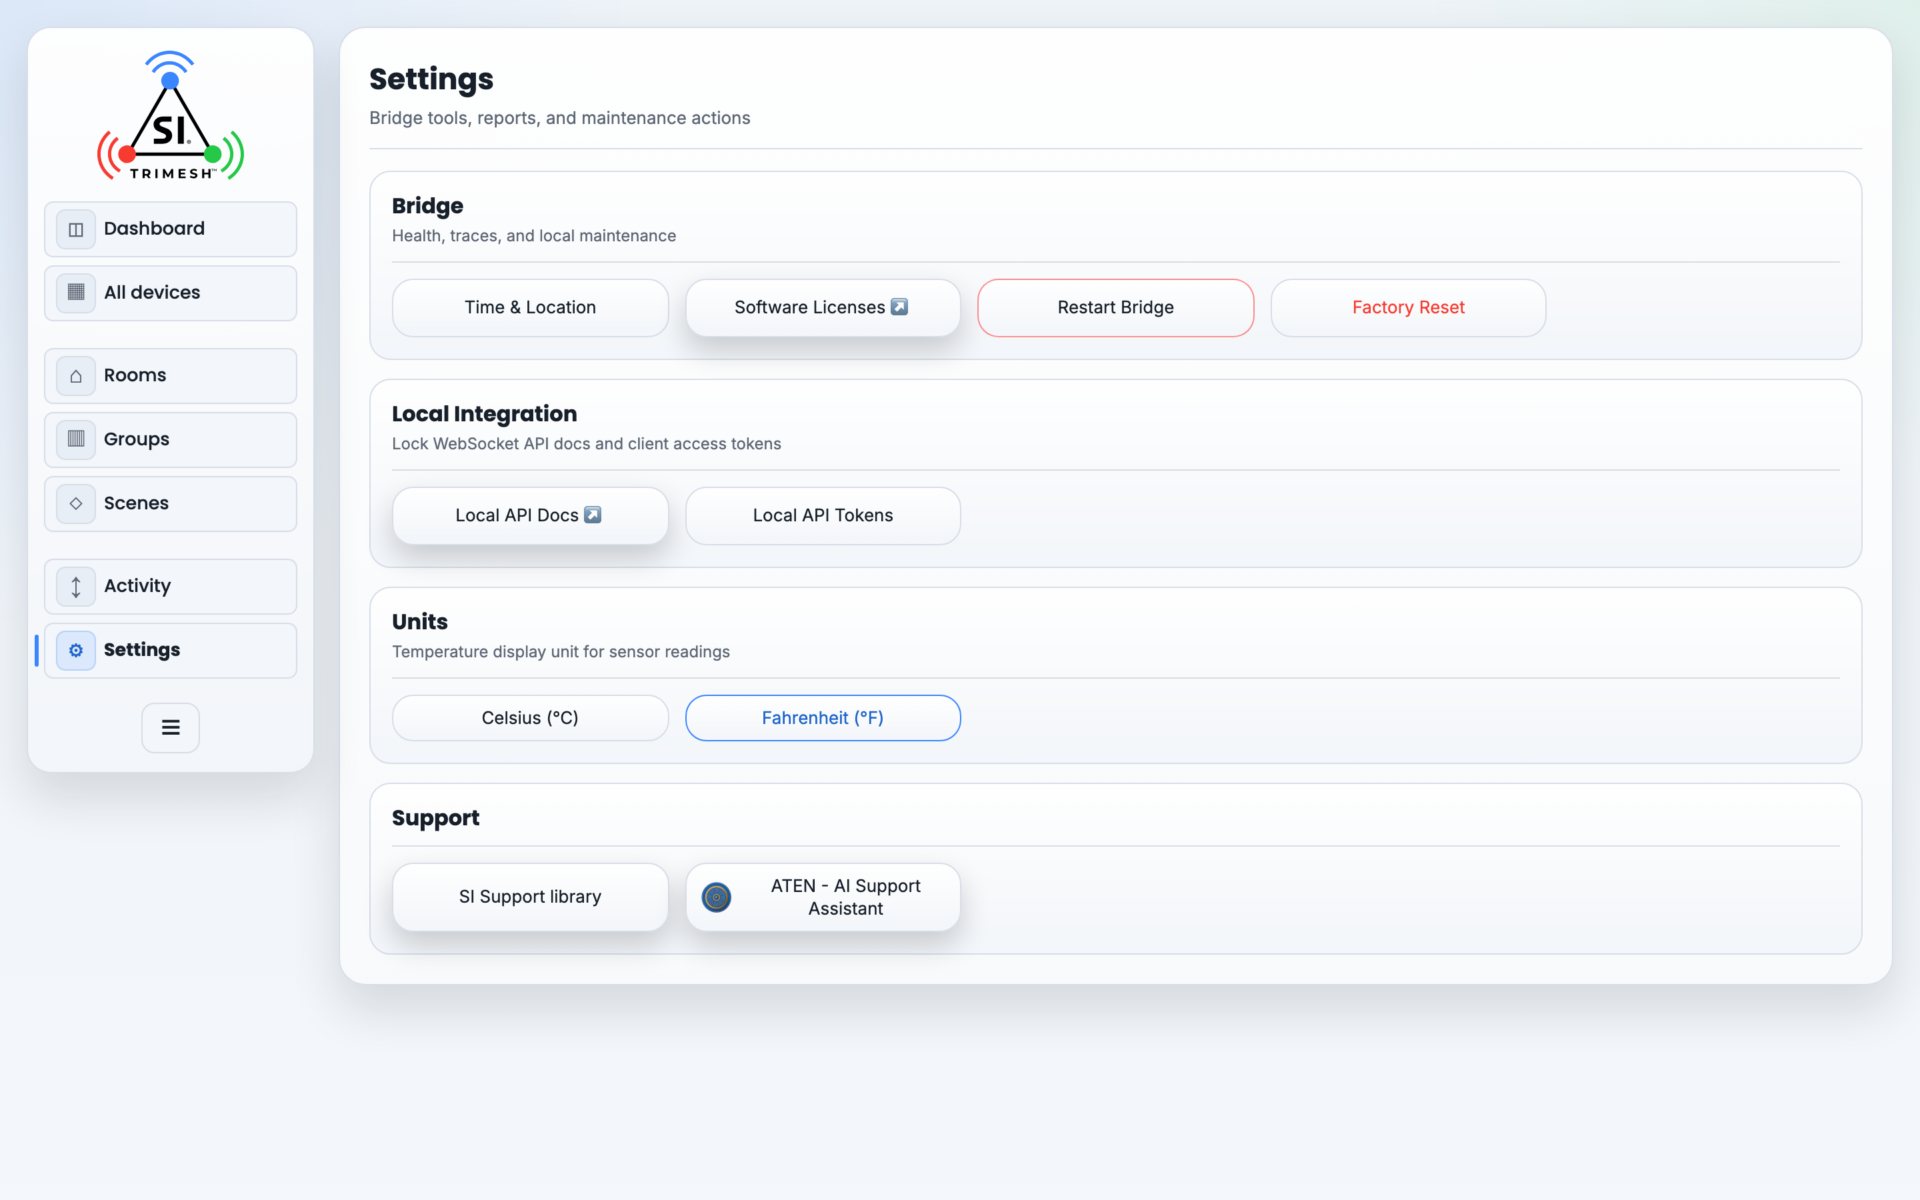
Settings in Simple view — the short, everyday list.
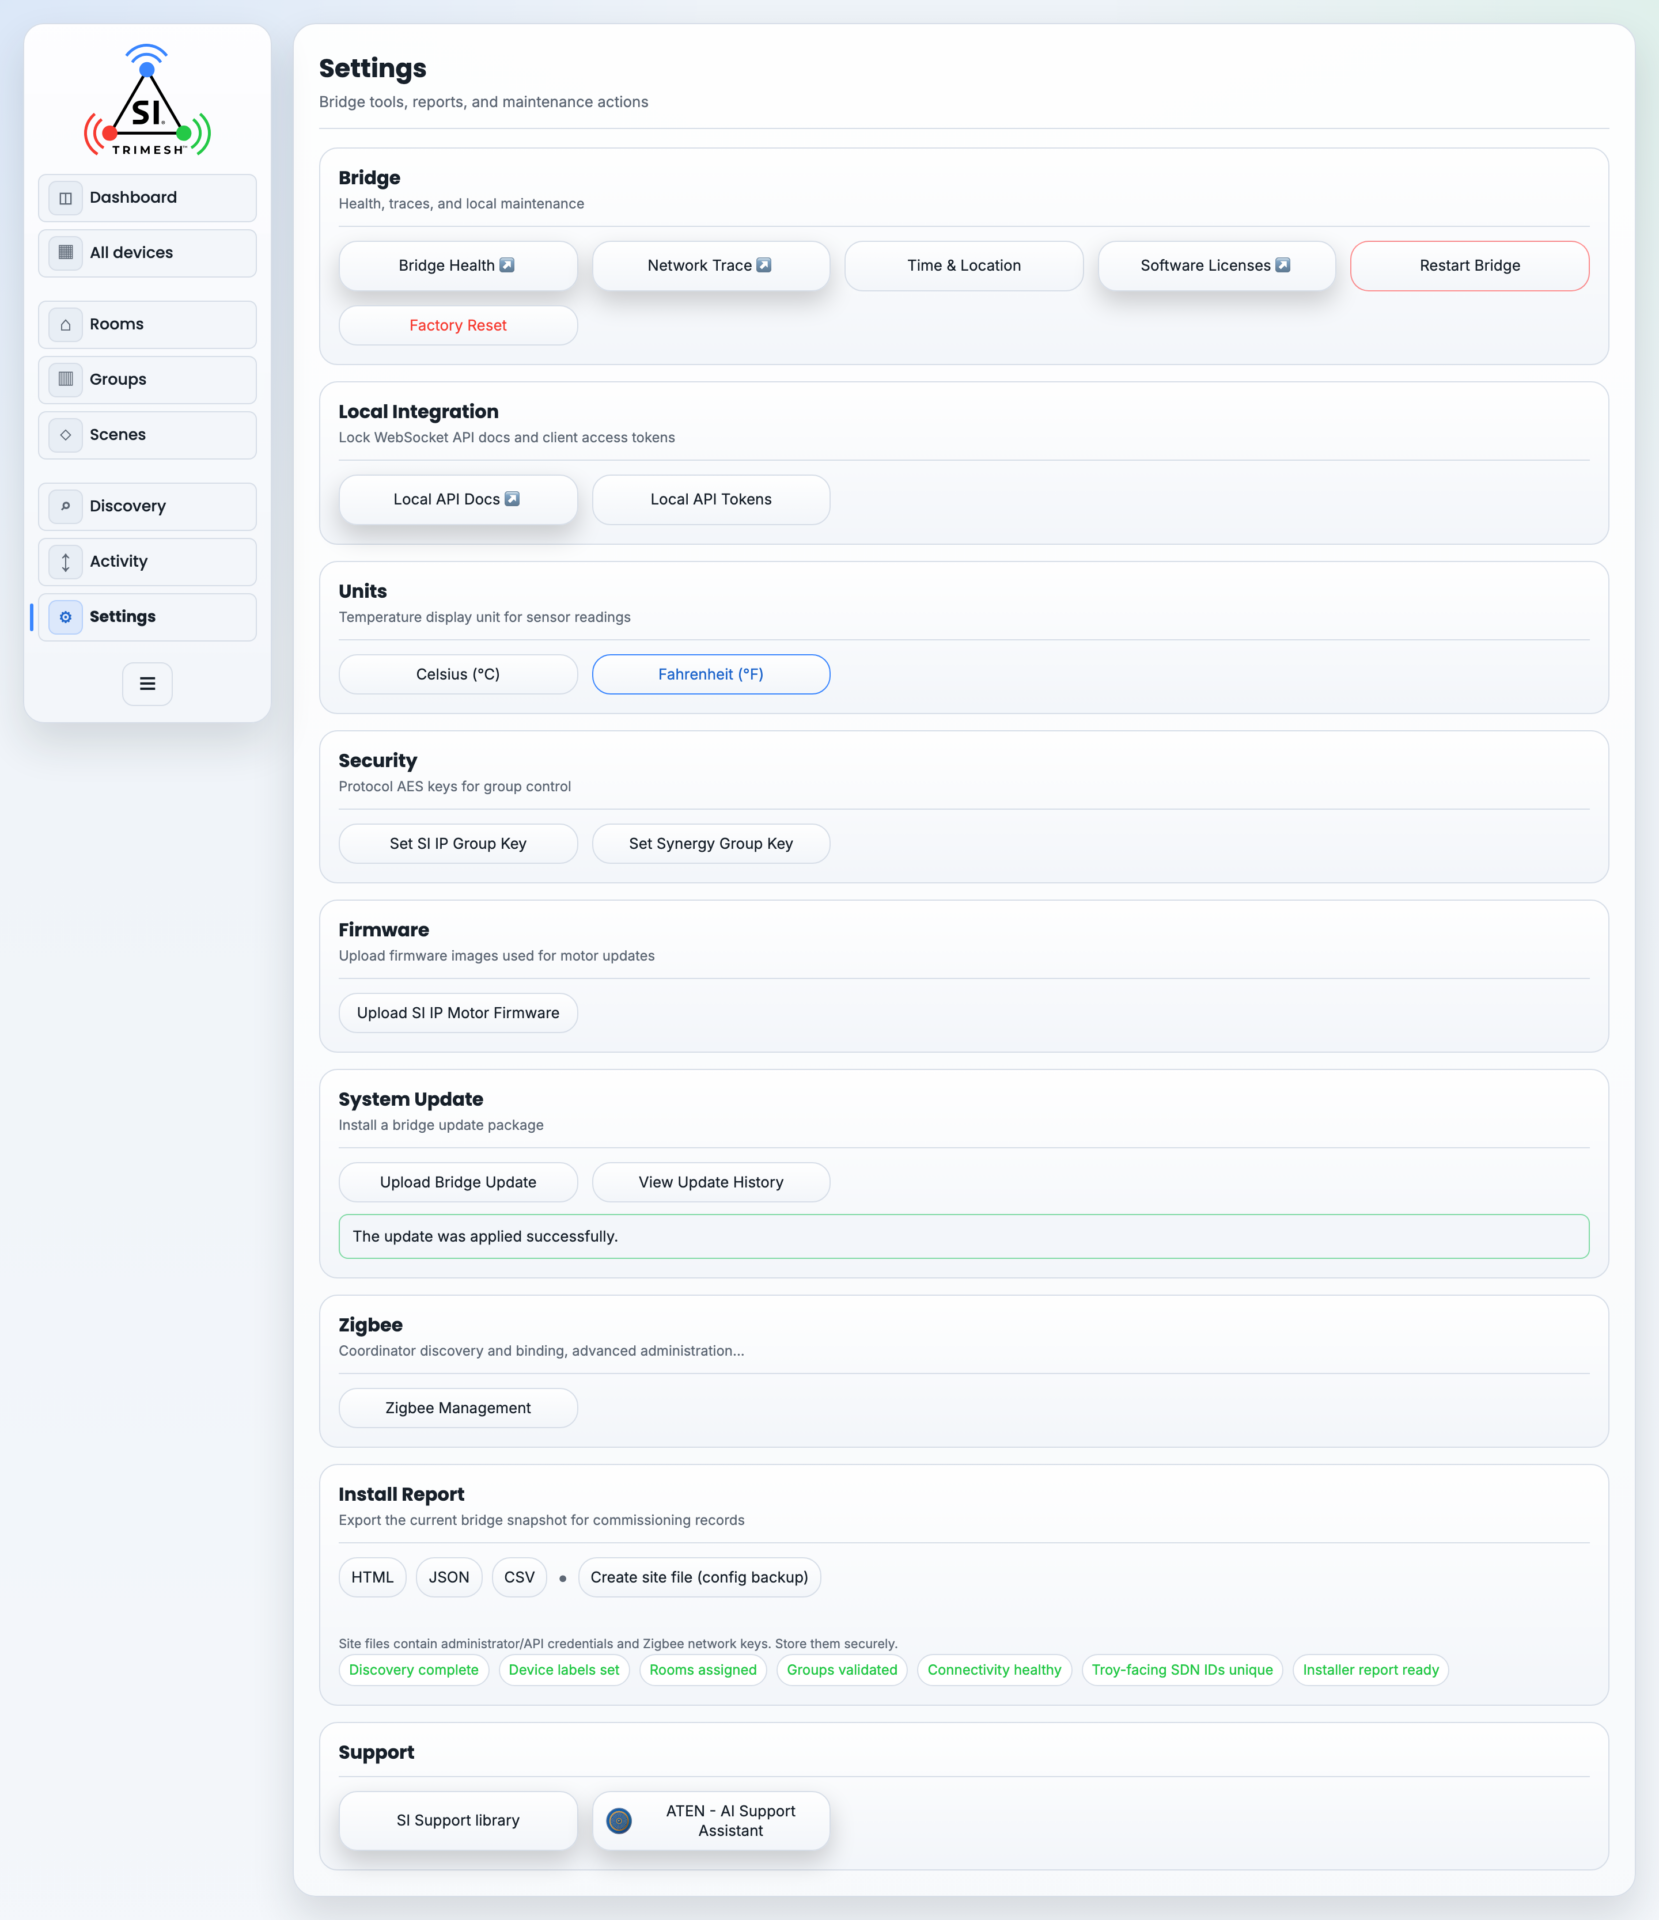
Settings in Advanced view, with every card including Security, Firmware, Zigbee and Install Report, and the installer checklist along the bottom.
Bridge – Bridge Health (Advanced) — opens the live status page (section 12.1). – Network Trace (Advanced) — opens the protocol traffic viewer (section 12.2). – Time & Location — time zone (US zones listed first), latitude, and longitude. Required once before scenes can use schedule or sunrise/sunset triggers. – Software Licenses — open-source license listing. – Restart Bridge — reboots the bridge software after a confirmation. Devices are not affected; the web session reconnects when it is back.
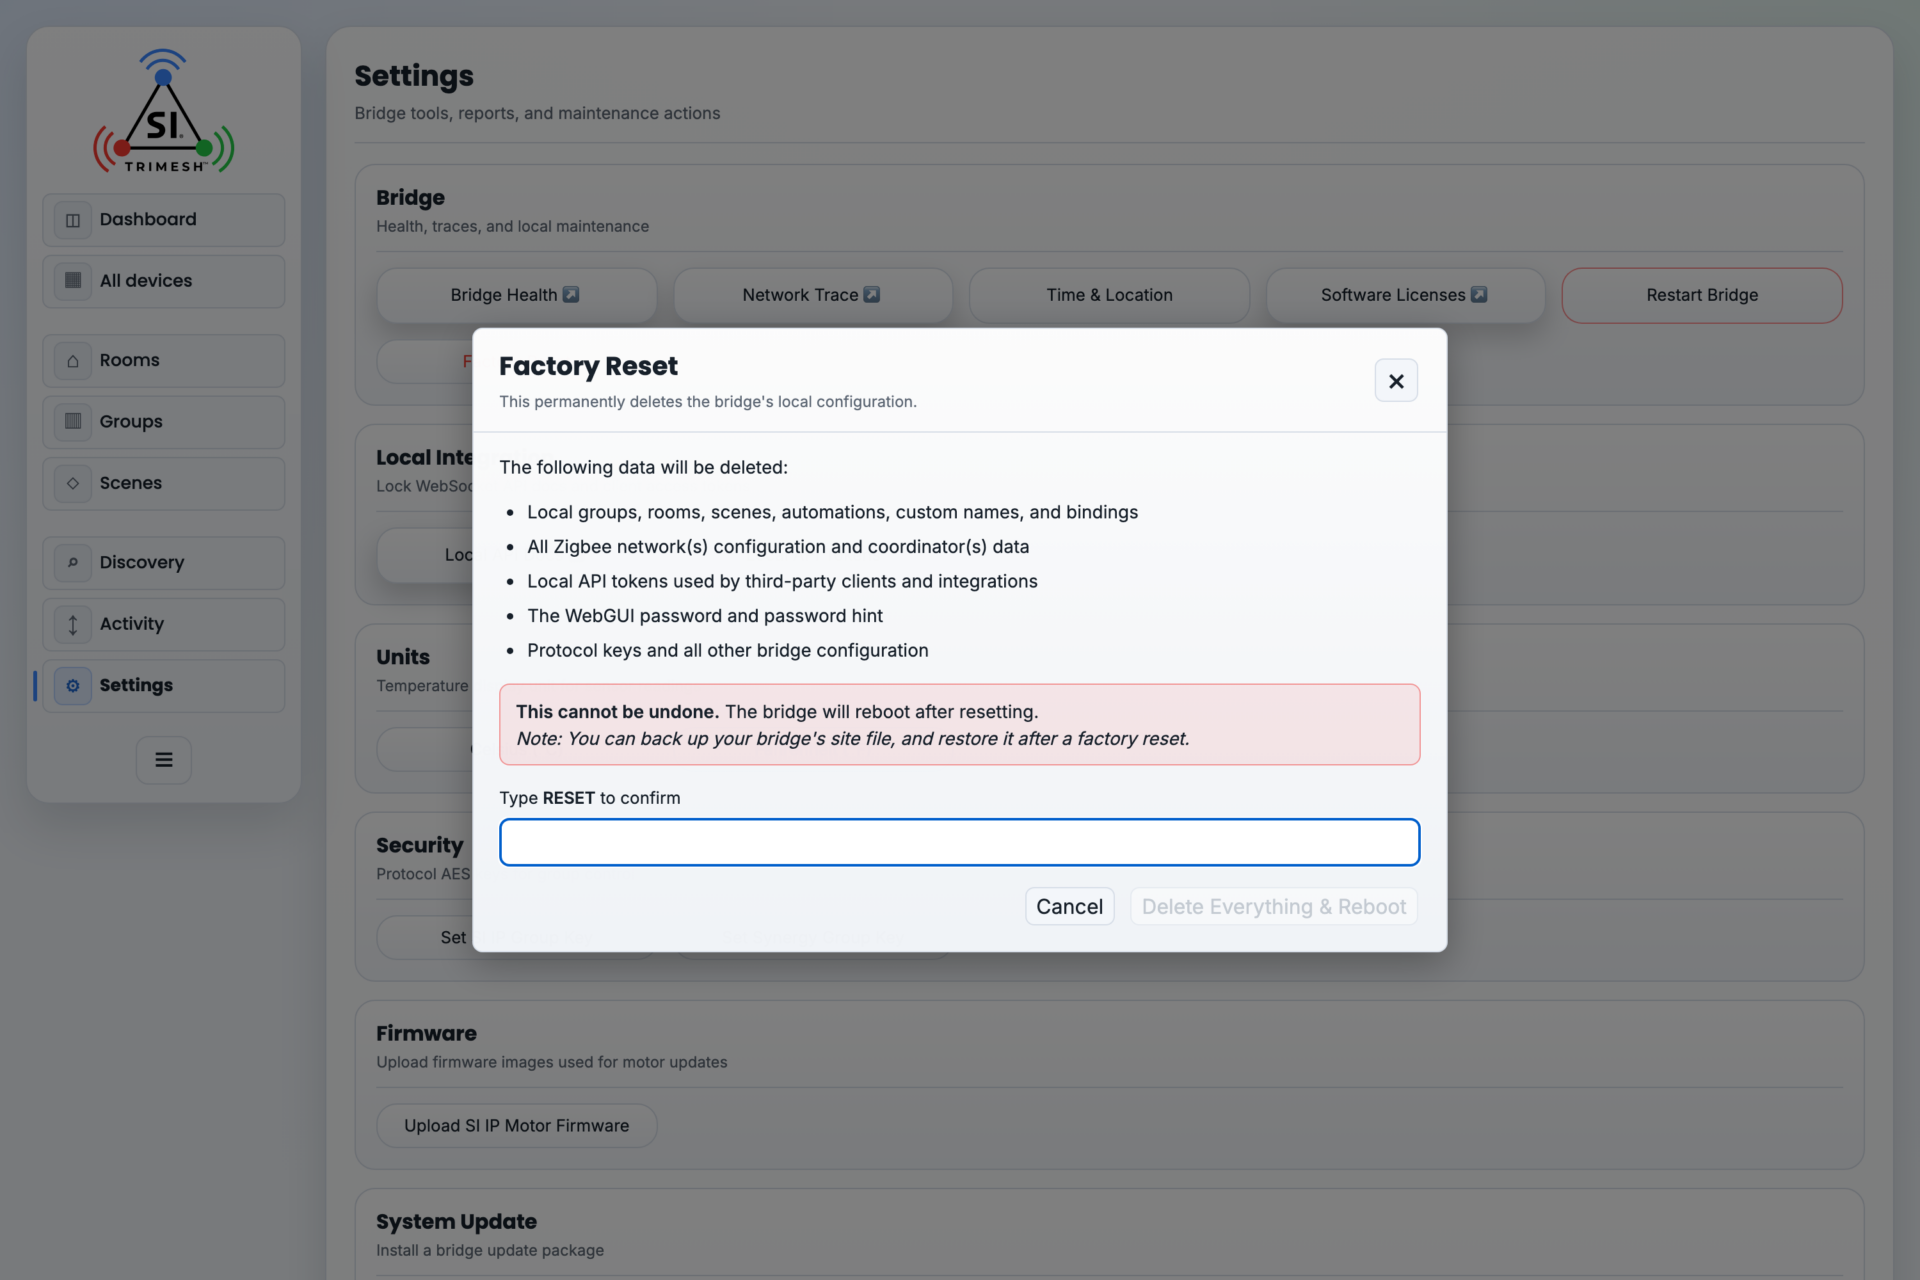
The Factory Reset confirmation, which lists exactly what it destroys and will not proceed until RESET is typed.
Factory Reset — erases the bridge’s entire local configuration and reboots to the setup page. It lists exactly what goes (groups, rooms, scenes, automations, names and bindings; every Zigbee network and coordinator’s data; local API tokens; the web password and hint; protocol keys) and requires typing
RESETbefore the Delete Everything & Reboot button becomes active. Afterwards the bridge returns to account creation, where a site file can be restored. Note this button is not limited to Advanced view.
Local Integration – Local API Docs — the built-in developer documentation for the WebSocket API (see section 11). – Local API Tokens — create and revoke access tokens for integrations (section 11.2).
Units – Temperature display in Celsius or Fahrenheit (affects sensor readings).
Security (Advanced) – Set SI IP Group Key / Set Synergy Group Key — the AES keys used for encrypted group control on those protocols.
Firmware (Advanced) – Upload SI IP Motor Firmware — stages a motor firmware file on the bridge; the update itself is started from the device’s control panel (section 8.6).
System Update (Advanced) – Upload Bridge Update — installs a bridge update package for the bridge only; the coordinator’s firmware is separate and is updated from the coordinator’s own page (see 6.1). It accepts a .zip between 1 byte and 100 MiB, asks for confirmation, then shows its progress through queued, verifying, applying, rebooting and applied. A blocking Bridge update in progress panel explains that the bridge will reboot and that the page will return to the login screen, counting down before it refreshes itself. – View Update History — the applied dates. Use these, or the dated build line in the left menu, to prove which build a bridge is on; the plain version number does not change between builds.
Zigbee (Advanced) – Zigbee Management — coordinator setup, pairing, OTA, groups, and health. Covered in sections 6 and 9.
Install Report (Advanced) – Exports a complete snapshot of the installation — bridge identity, network details, protocol status, and every device with model, firmware, room, groups, coordinator assignment and health — as HTML (customer-ready), JSON, or CSV. Generate one at the end of every job for the project file; it is the “as-built” record of the installation. It does not record limits or scenes. – What the summary tiles tell you at a glance: total Devices, Troy Exposed (how many motors the bridge is publishing to a TRO.Y — with a TRO.Y linked it reads the motor count plus one for the link row itself, and with no TRO.Y attached it simply equals the motor count; a figure lower than the motor count means that many shades never got a TRO.Y address), Warnings, and Bridge Uptime. A warning count of zero on a finished job is what you are aiming for. – The device table on v1.2 has these columns: Device, Protocol, Troy SDN, Native ID, Location, Type, Model, IP, Online, Groups, Troy Groups, Zigbee Coordinator, Raw LQI, and Warnings. The last two are new in v1.2 and are the reason this export is now worth keeping for troubleshooting as well as for the project file: you can see which coordinator every Zigbee device is on, and its raw link quality, without opening the network map. The CSV carries the same information plus Firmware and Zigbee Coordinator Serial; the JSON carries everything, including bridge health, per-protocol status and each device’s interview state. – “Yes / unknown” in the Online column is normal, not a fault. The two halves are the protocol and the device: the first says the bridge’s radio or bus for that protocol is up, the second says whether the bridge has recently heard from that particular device. For Zigbee the second half reads unknown almost all of the time, because the bridge does not poll sleeping devices. On a healthy system nearly every Zigbee row reads “Yes / unknown”. Read it as “nothing is wrong here”, and judge devices that genuinely are not answering by the network map and the Last frame column in Discovery instead. – A blank Raw LQI means not measured, not no signal. Coordinators have no link quality to themselves, and a device the bridge has not heard from since it started will not have a figure yet. A number that is present and low is meaningful; a blank is not. – A report taken in the first minutes after a reboot shows blank online state and signal for devices the bridge has not heard from yet. Give it a few minutes before generating the one you keep. – Create site file (config backup) — one archive holding the bridge configuration plus a Zigbee network backup per coordinator. If a coordinator’s backup fails, the panel says which slot and offers Retry or Download partial site file. The page’s own warning applies: “Site files contain administrator/API credentials and Zigbee network keys. Store them securely.”
Support – A single tile carrying the ATEN logo, which opens SI’s AI support assistant (siagent.screeninnovations.com) in a new tab. On firmware v1.2 this is the only link on the card — ATEN is the bridge’s support front door. How to use it when something is wrong is in section 12.7.
6. Adding Devices #
6.1 Zigbee — Setting Up a Coordinator (one-time) #
Zigbee devices reach the bridge through a coordinator. Supported coordinators are the SONOFF Dongle-M and SMLIGHT SLZB-06 series. They attach to the local network and the bridge finds them automatically.
Coordinator hardware setup (SONOFF Dongle-M) #
The Dongle-M ships with the unit, a 1 m USB-C cable, a mounting bracket, double-sided tape, and screws. Two ways to power it:
PoE (recommended for installs): one RJ45 cable from a PoE switch or injector carries both network and power (48 V, 0.25 A). Cleanest result — no wall adapter at the coordinator’s location.
USB-C (5 V, 1 A) plus Ethernet: power from any USB adapter, network over a separate RJ45 cable. (Wi-Fi is also possible, but use wired for installations — the shades depend on this link.)
Read the LED: solid orange means the coordinator has power and is starting up; solid blue means it is online. Wait for blue before scanning from the bridge.
Placement matters more than for any other device — this is the one box every wireless shade talks to. Mount it central to the shades, in the open, away from the Wi-Fi router, metal enclosures, and large appliances. The included bracket and tape support wall mounting.
Mode note: the Dongle-M can run as a Zigbee coordinator (“gateway”), a Zigbee router, or a Thread radio. It must be in its factory Zigbee gateway mode for the bridge. A factory-fresh unit is already correct; a reused one should be factory reset first (hold its button about 10 seconds until the LED blinks red) so the bridge’s Auto-provision can adopt it.
The coordinator’s own web page, and updating its firmware #
The coordinator is a small computer in its own right, with its own web page and its own firmware, separate from the bridge’s. A bridge update does not update the coordinator. Updating it is part of a first install, and it is done from the coordinator’s page, not the bridge’s.
Finding the page. On the bridge, open Discovery / Pairing: the coordinator’s row shows its IP address. Browse to http:// followed by that address (plain http, not https). With a single coordinator, http://dongle-m.local also works; with more than one, every coordinator answers to that name, so use the address from the Discovery row instead. The username is admin. The password depends on which box you set up first:
The bridge was on the network first (the normal order). When the bridge adopted the coordinator, Auto-provision gave the coordinator a password you never typed. Read it off the bridge: Settings → Zigbee → Zigbee Management → Coordinators → Coordinator API credentials, then press the eye button (Show API password) on that coordinator’s slot. Log in to the coordinator’s page with
adminand that password.You opened the coordinator’s page first (bridge not yet on the network). The page asks you to create a password — at least 8 characters. Write it down. Later, when the bridge is up, Auto-provision will not work on this coordinator (it only works on one that has never had a password), so type that same password into the bridge’s Coordinator API credentials for the slot and press Save. The two must match: a mismatch shows up as the channel scan being refused with “Unauthorized”.
If the coordinator’s password is lost: power-cycle it and double-click its button within 10 seconds, which opens a 5-minute window to set a new one (coordinator maker’s guide) — then set the same one on the bridge.
Updating the firmware. In the coordinator’s left menu, open Firmware. It has two entries because the coordinator has two chips: EFR32MG24, the Zigbee side, and ESP32-D0WDR2-V3, the network side. For each one:
Open the entry. It shows Current Version and Latest Version (Stable and Beta).
Press Check for Updates. Stay on the Stable tab; each version is listed with its release notes and a Flash Firmware button.
Press Flash Firmware on the newest stable version, then leave the coordinator alone until it finishes and comes back. Do not unplug it.
Repeat for the other chip.
Back on Overview, the Current Version tile should read “The firmware is up to date.” (The Custom Firmware → Upload & Flash Firmware control is for a file SI sends you; a normal install never needs it.)
Turn on Automatic Updates. On the same Firmware page, switch on Automatic Updates. The coordinator describes it exactly: “Automatically update to the latest stable firmware for EFR32MG24 and ESP32-D0WDR2-V3 between 02:00 and 03:00 at night.” Check Overview → Device Status → Automatic Updates now reads Enabled. Updates arrive overnight and the coordinator restarts itself afterward, so expect the wireless network to be briefly unavailable in that window.
Do this on every coordinator on a multi-coordinator job — each has its own firmware and its own switch.
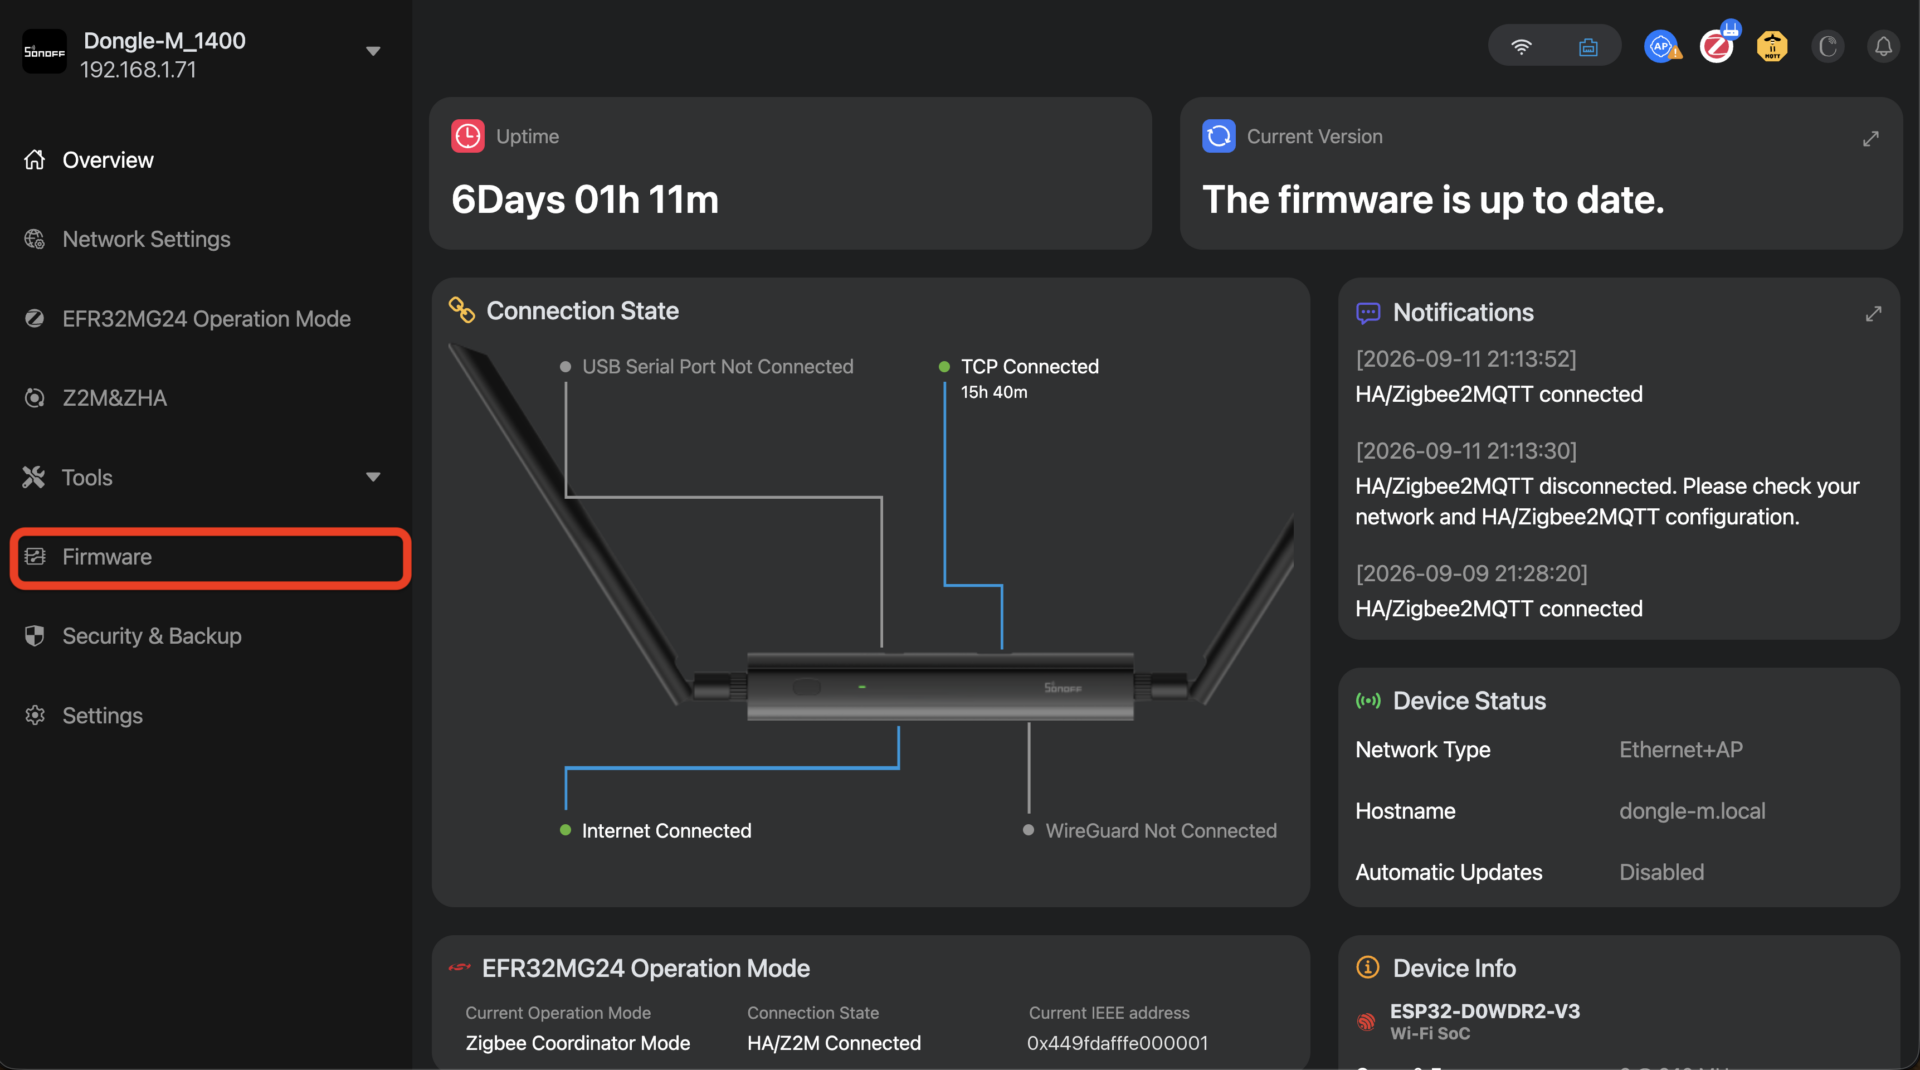
The coordinator’s own page. The left menu has Firmware; the Device Status panel on the right shows Automatic Updates and the hostname.
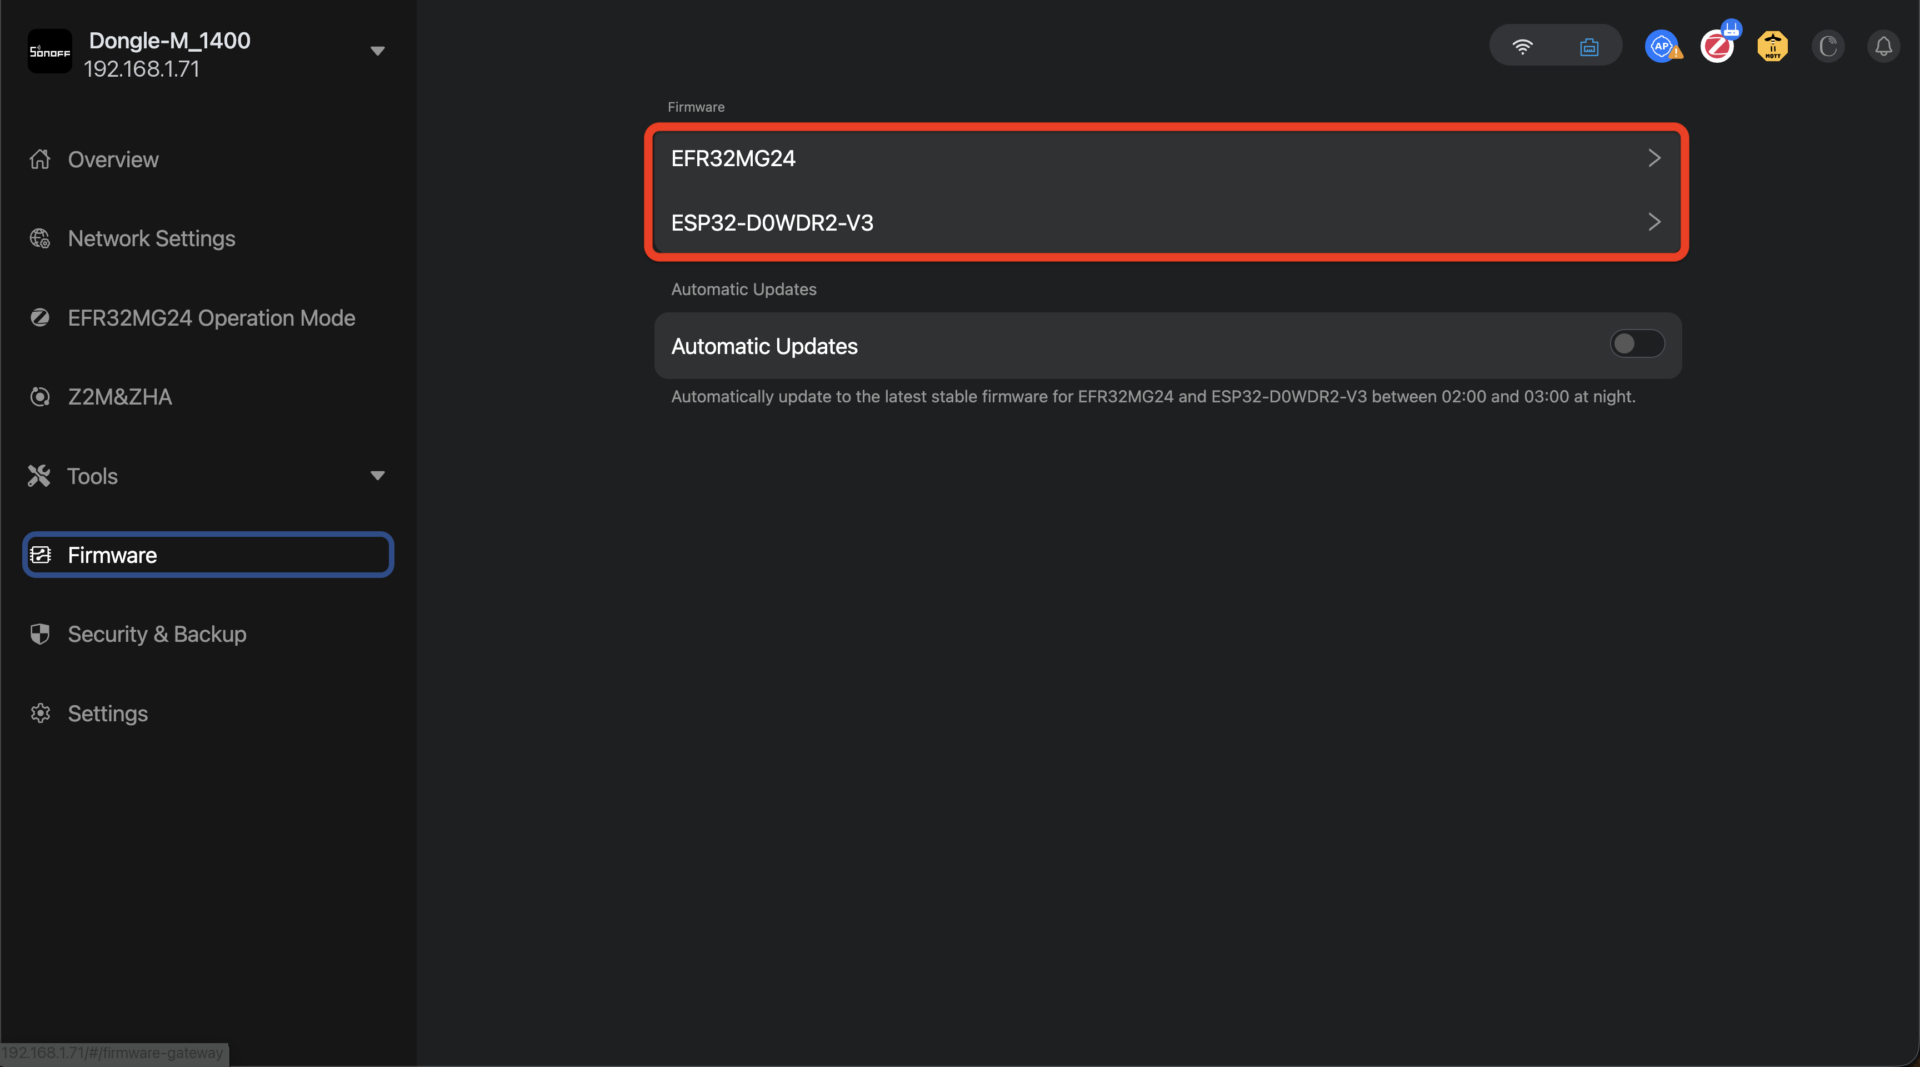
The Firmware page: one entry per chip — EFR32MG24 and ESP32-D0WDR2-V3 — and the Automatic Updates switch.
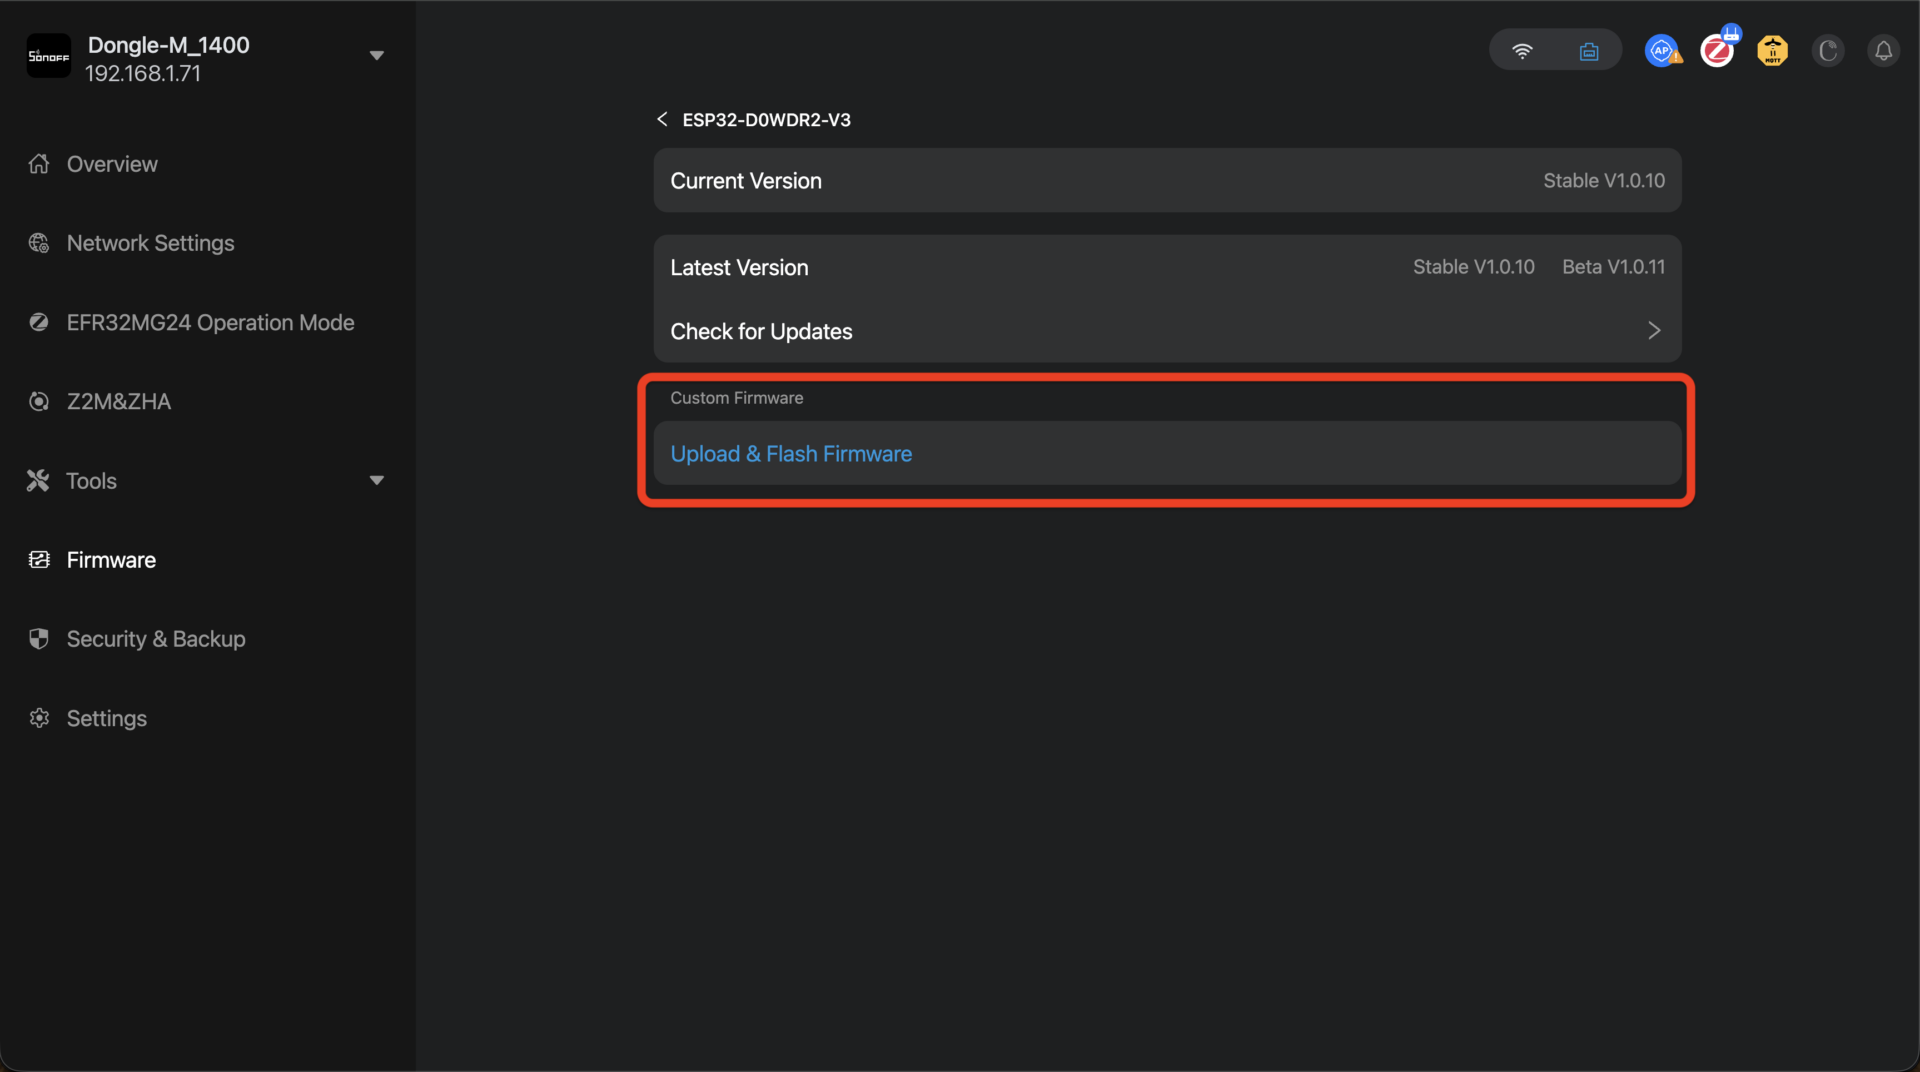
Inside a chip’s entry: Current Version, Latest Version (Stable and Beta), Check for Updates, and the Custom Firmware upload used only for a file SI sends you.
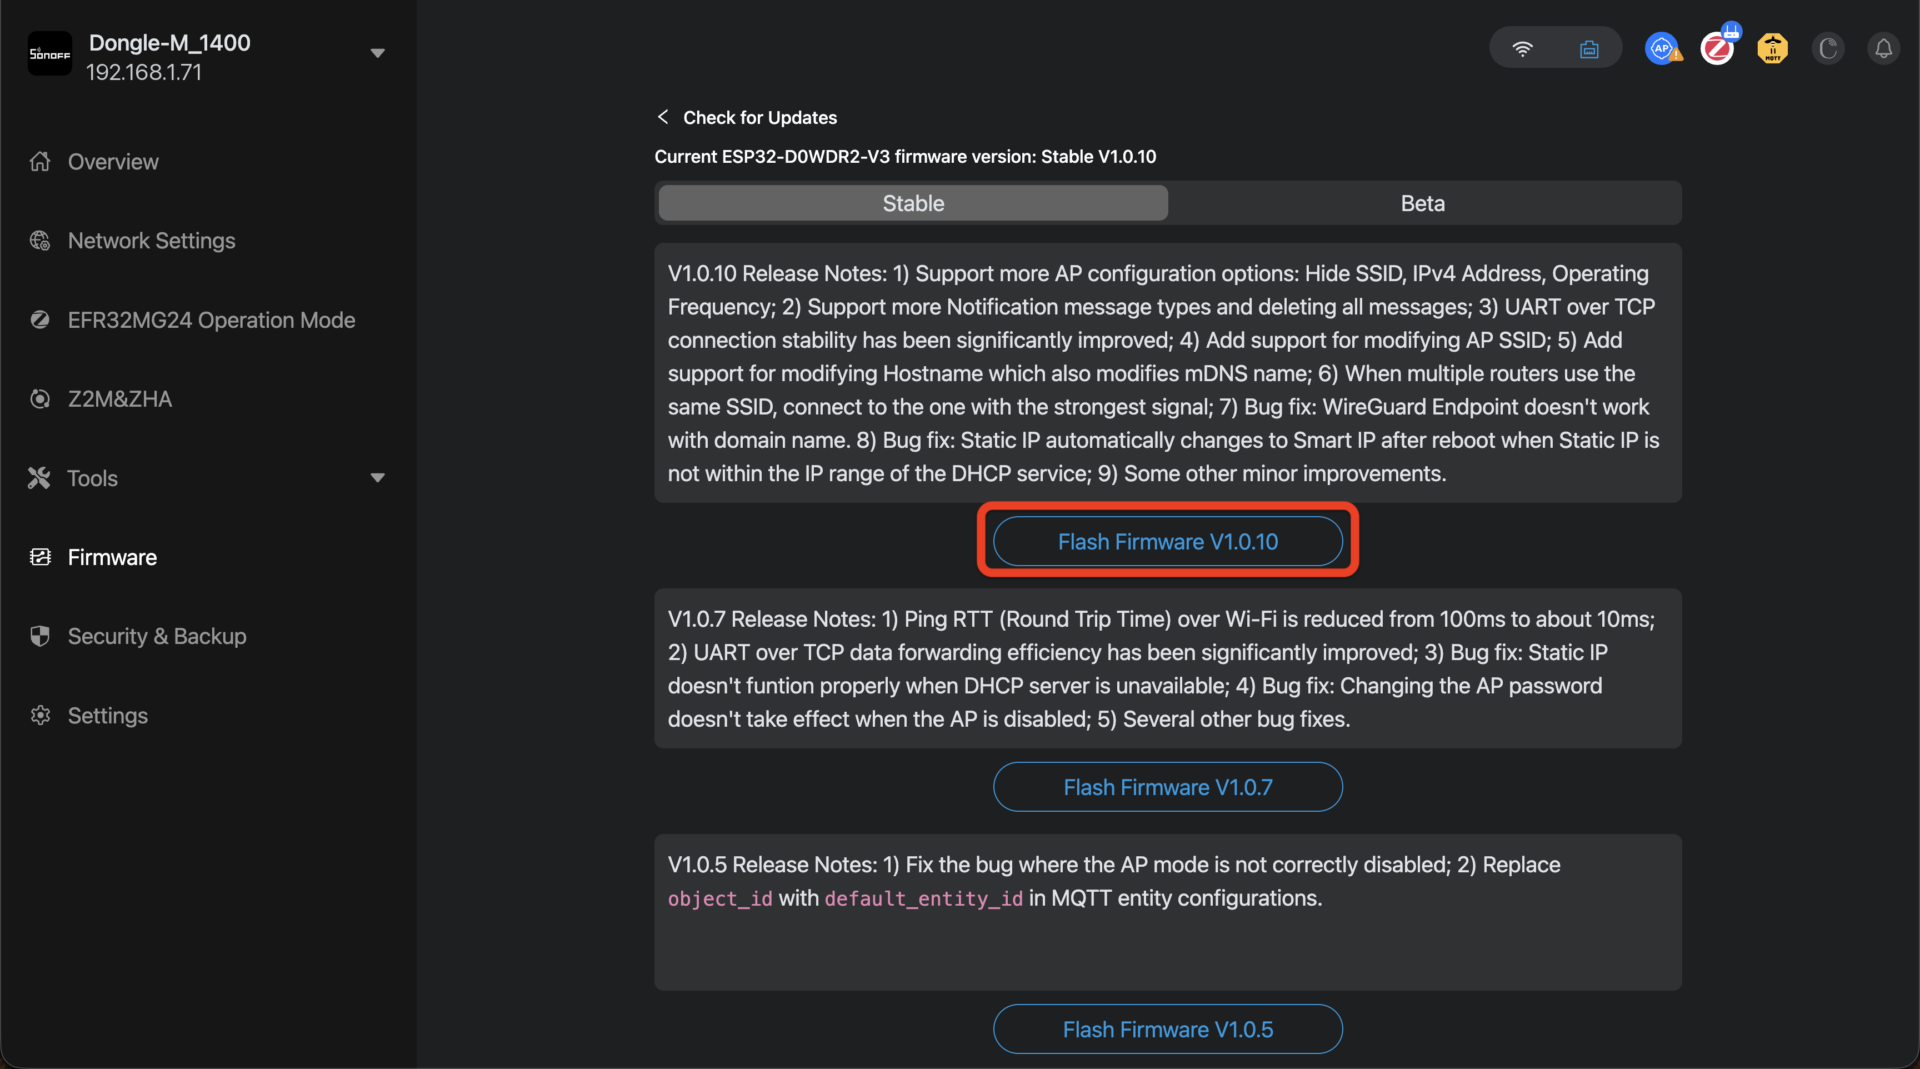
After Check for Updates: the Stable tab lists each version with its release notes and a Flash Firmware button. Take the newest stable; leave Beta alone.
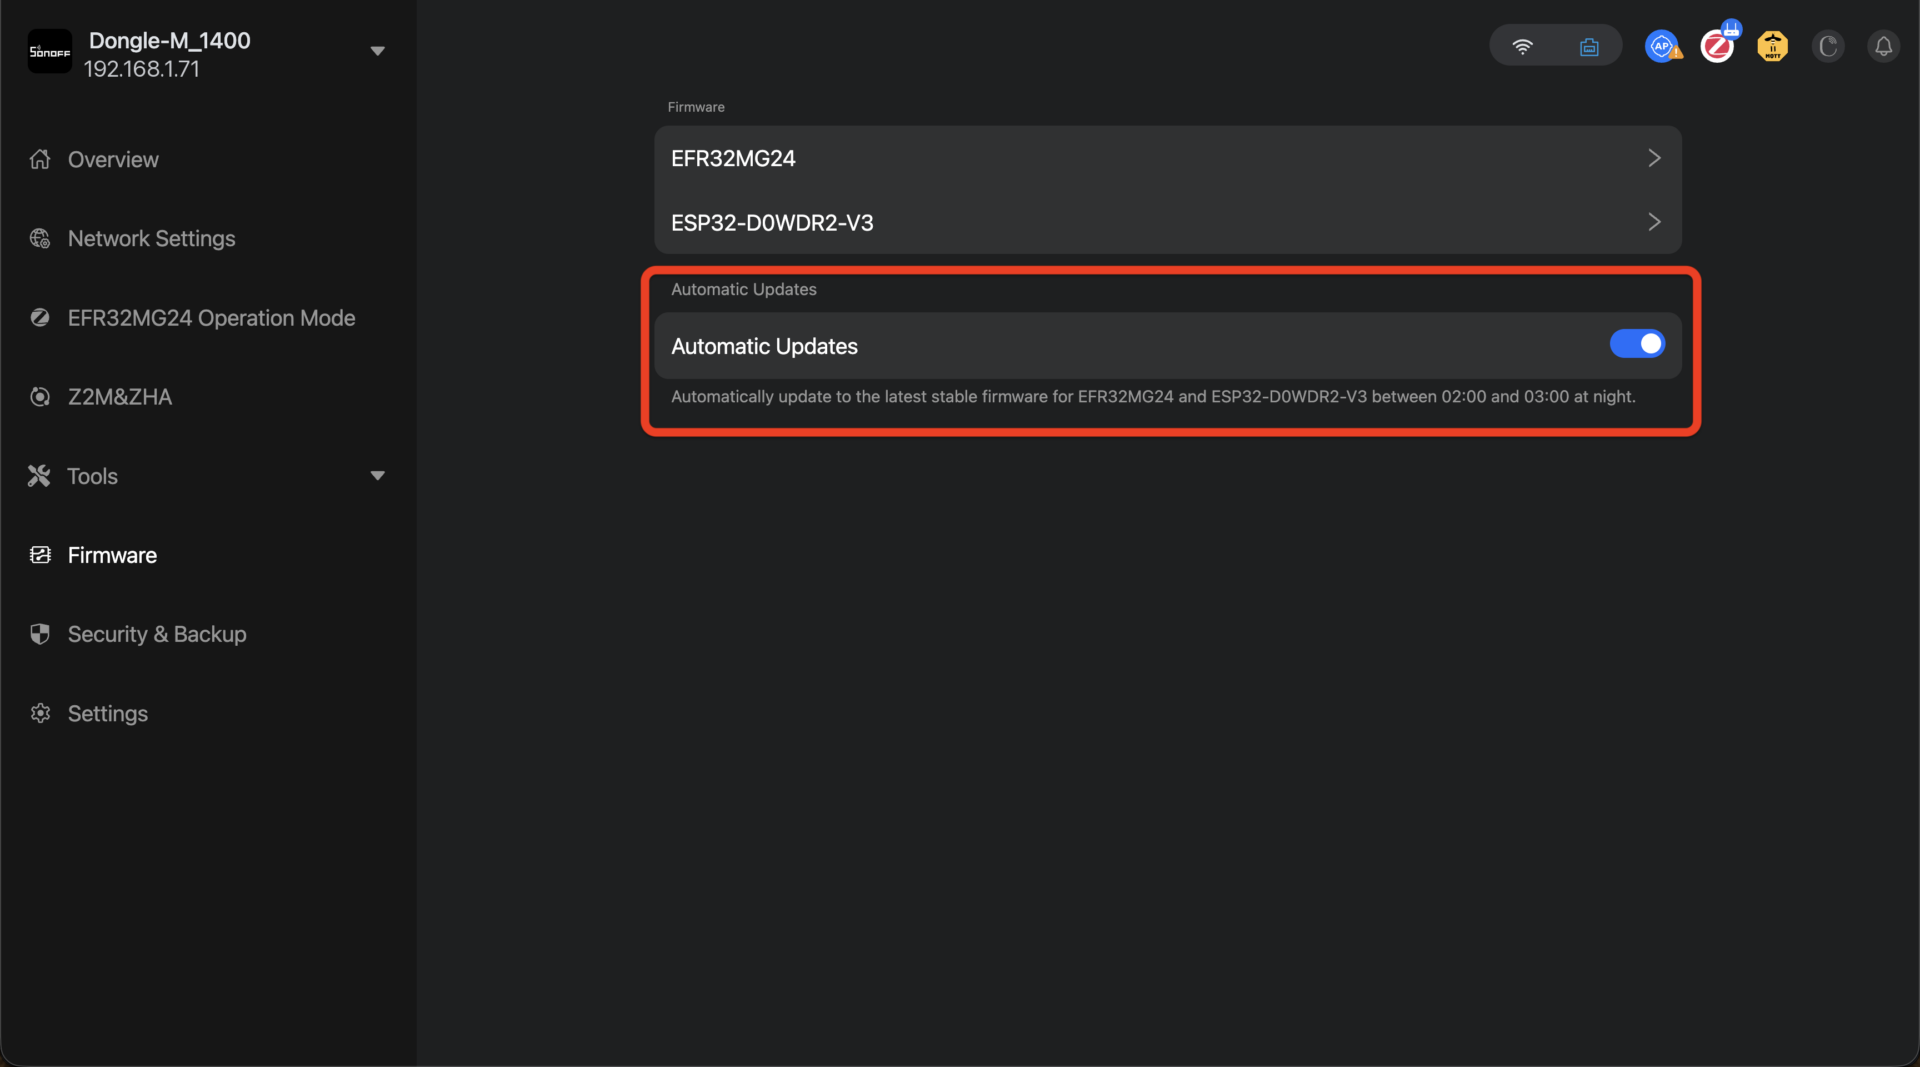
Automatic Updates switched on: “Automatically update to the latest stable firmware for EFR32MG24 and ESP32-D0WDR2-V3 between 02:00 and 03:00 at night.”
Binding the coordinator to the bridge #
In Settings → Zigbee Management → Coordinators (Advanced view):
Press Scan for coordinators. Discovered units appear with their serial numbers.
Choose the discovered coordinator and a slot (#1, #2, or #3), then press Bind to slot. The slot is now that coordinator’s permanent home on this bridge.
Repeat for additional coordinators (large sites only). Each slot is an independent Zigbee network.
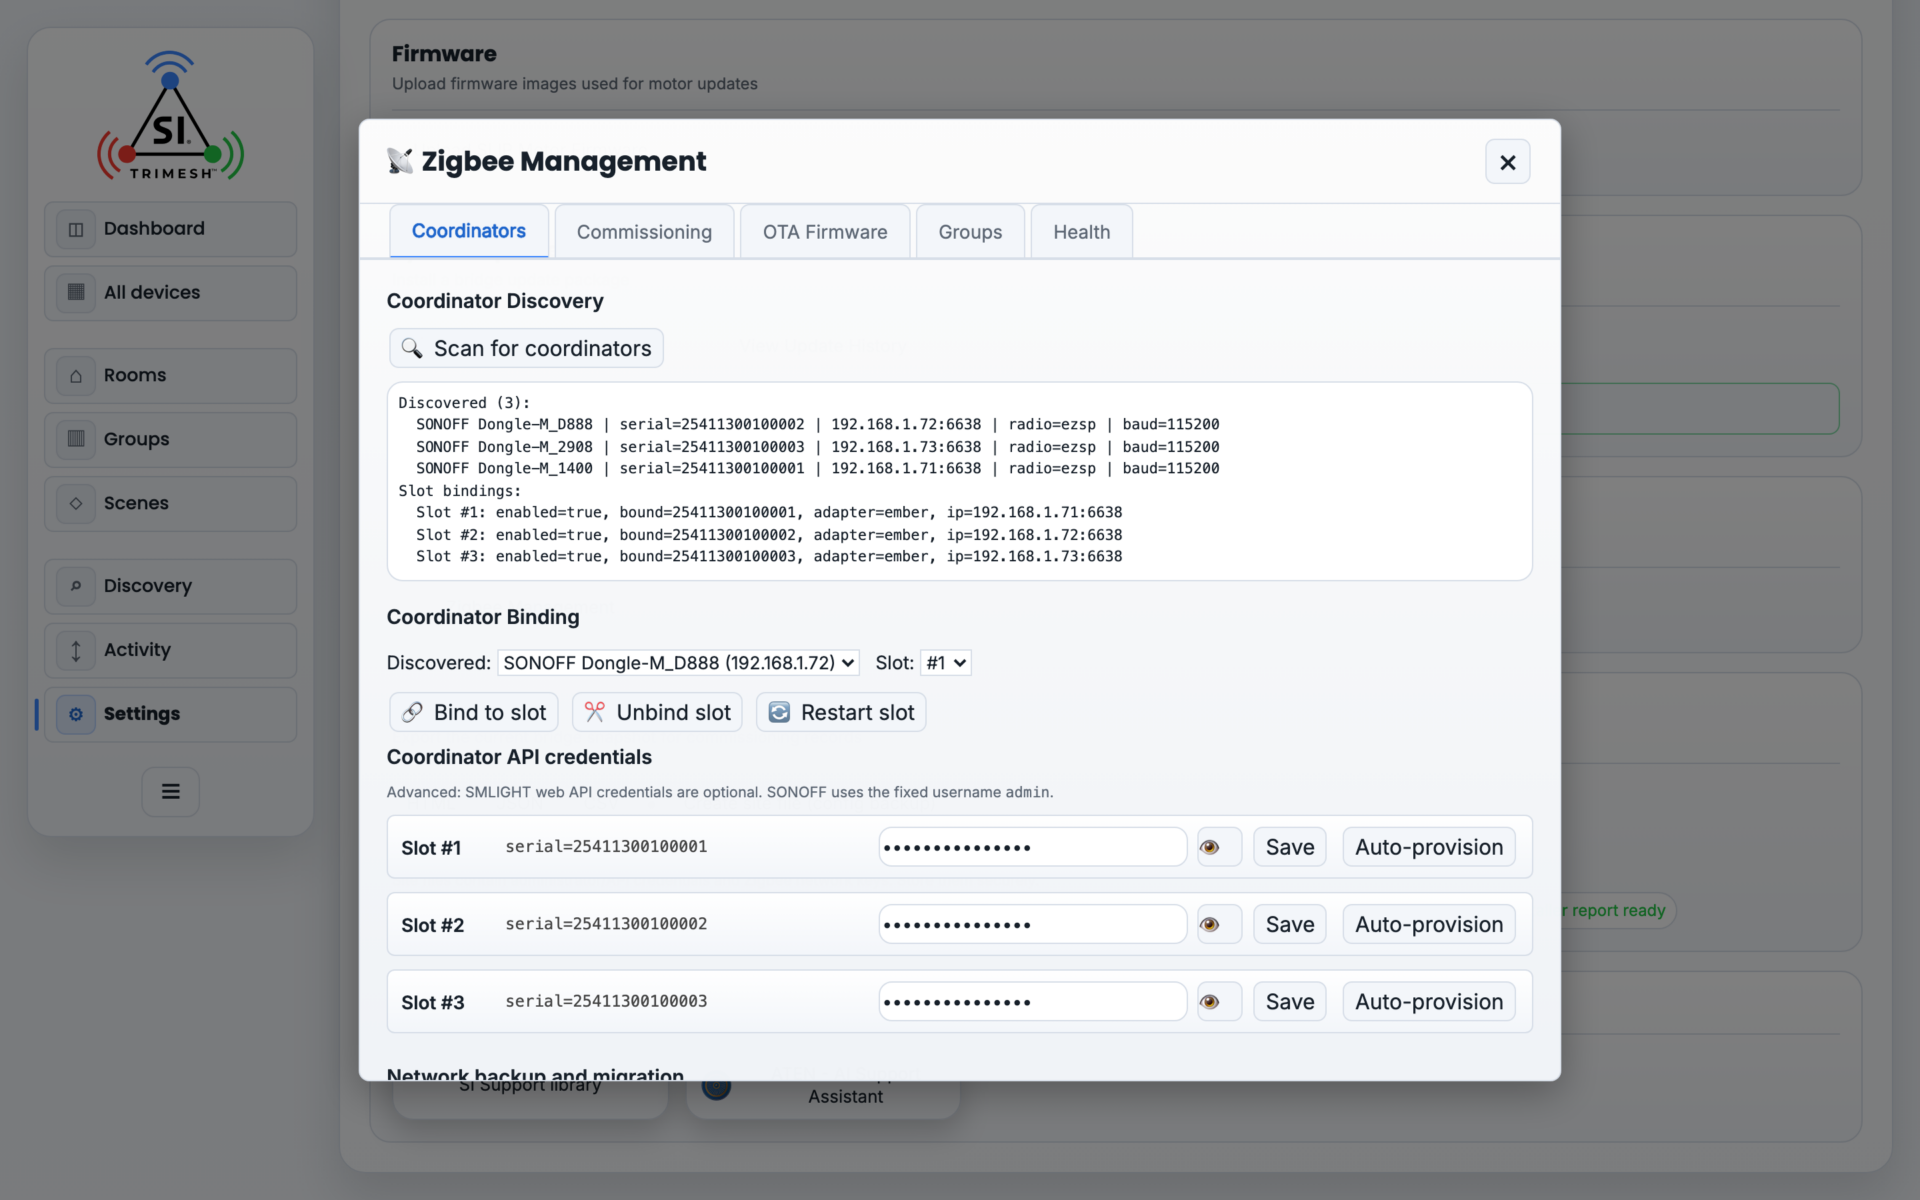
The Coordinators tab, where a coordinator is bound to a slot and its API credentials are stored.
The Coordinators tab also holds:
Coordinator API credentials — the coordinator web-console credentials the bridge uses for advanced features (channel scans, backups). SONOFF uses the fixed username
admin. Auto-provision sets everything up automatically, but only on a coordinator that was just factory-reset (hold its button about 10 seconds until it blinks red). Without credentials, basic operation still works — only the channel-health and backup tools are locked out.Restart slot — restarts the Zigbee service for one slot without touching the others.
Network backup and migration — see section 9.5.
6.2 Zigbee — Pairing Devices #
Pairing lives in Settings → Zigbee Management → Commissioning:
Select the coordinator that should adopt the new device.
Set the pairing window in seconds (default 180, maximum 254) and press Enable pairing. A countdown shows the window closing; pairing can be open on only one coordinator at a time. The same action is available on the Discovery / Pairing page — a coordinator picker and an Open network for pairing button, which uses the seconds value set here. Entering 0 does not close a window; it is read as unset and becomes 180.
Put the device into its joining mode:
Nano (Somfy motors) — push and hold the motor head button through two jogs; the LED flashes amber.
Nino (SI motors) — push and hold the motor head button through two jogs; the LED flashes red.
Smart Plugs and Smart Outlets — push and hold the button until the LED begins to flash.
For third-party devices, follow the manufacturer’s pairing instructions. 4. The device appears in Discovery within a few seconds, first as “interviewing” while the bridge learns its capabilities, then fully controllable. 5. Press Disable pairing when done — do not leave the network open.
After pairing, do the three-step commissioning pass for each device: Identify it (jog/blink) to confirm which physical unit it is, rename it, and assign its room (sections 5.7, 8.1, 5.4).
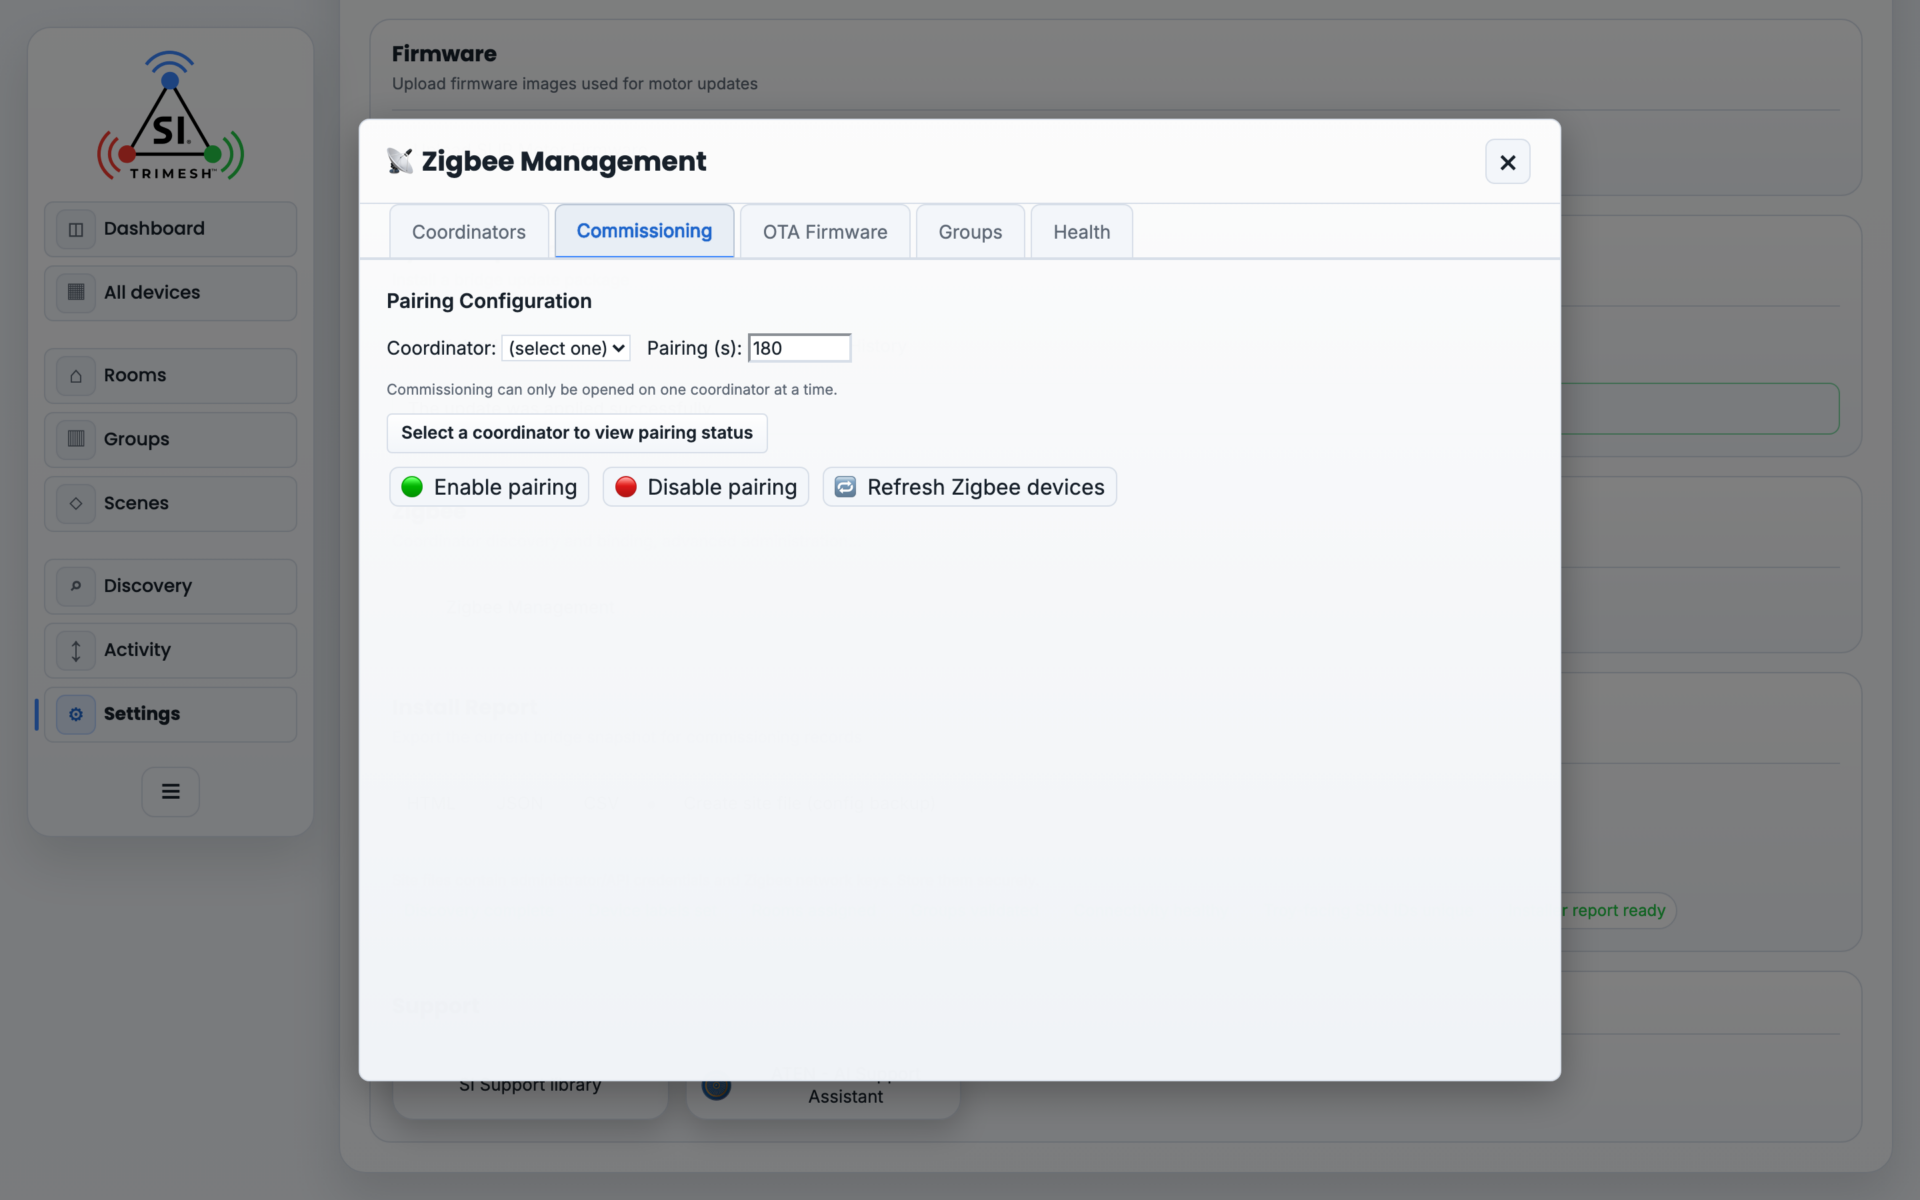
The Commissioning tab: the coordinator selector, the pairing window length, and Enable/Disable pairing.
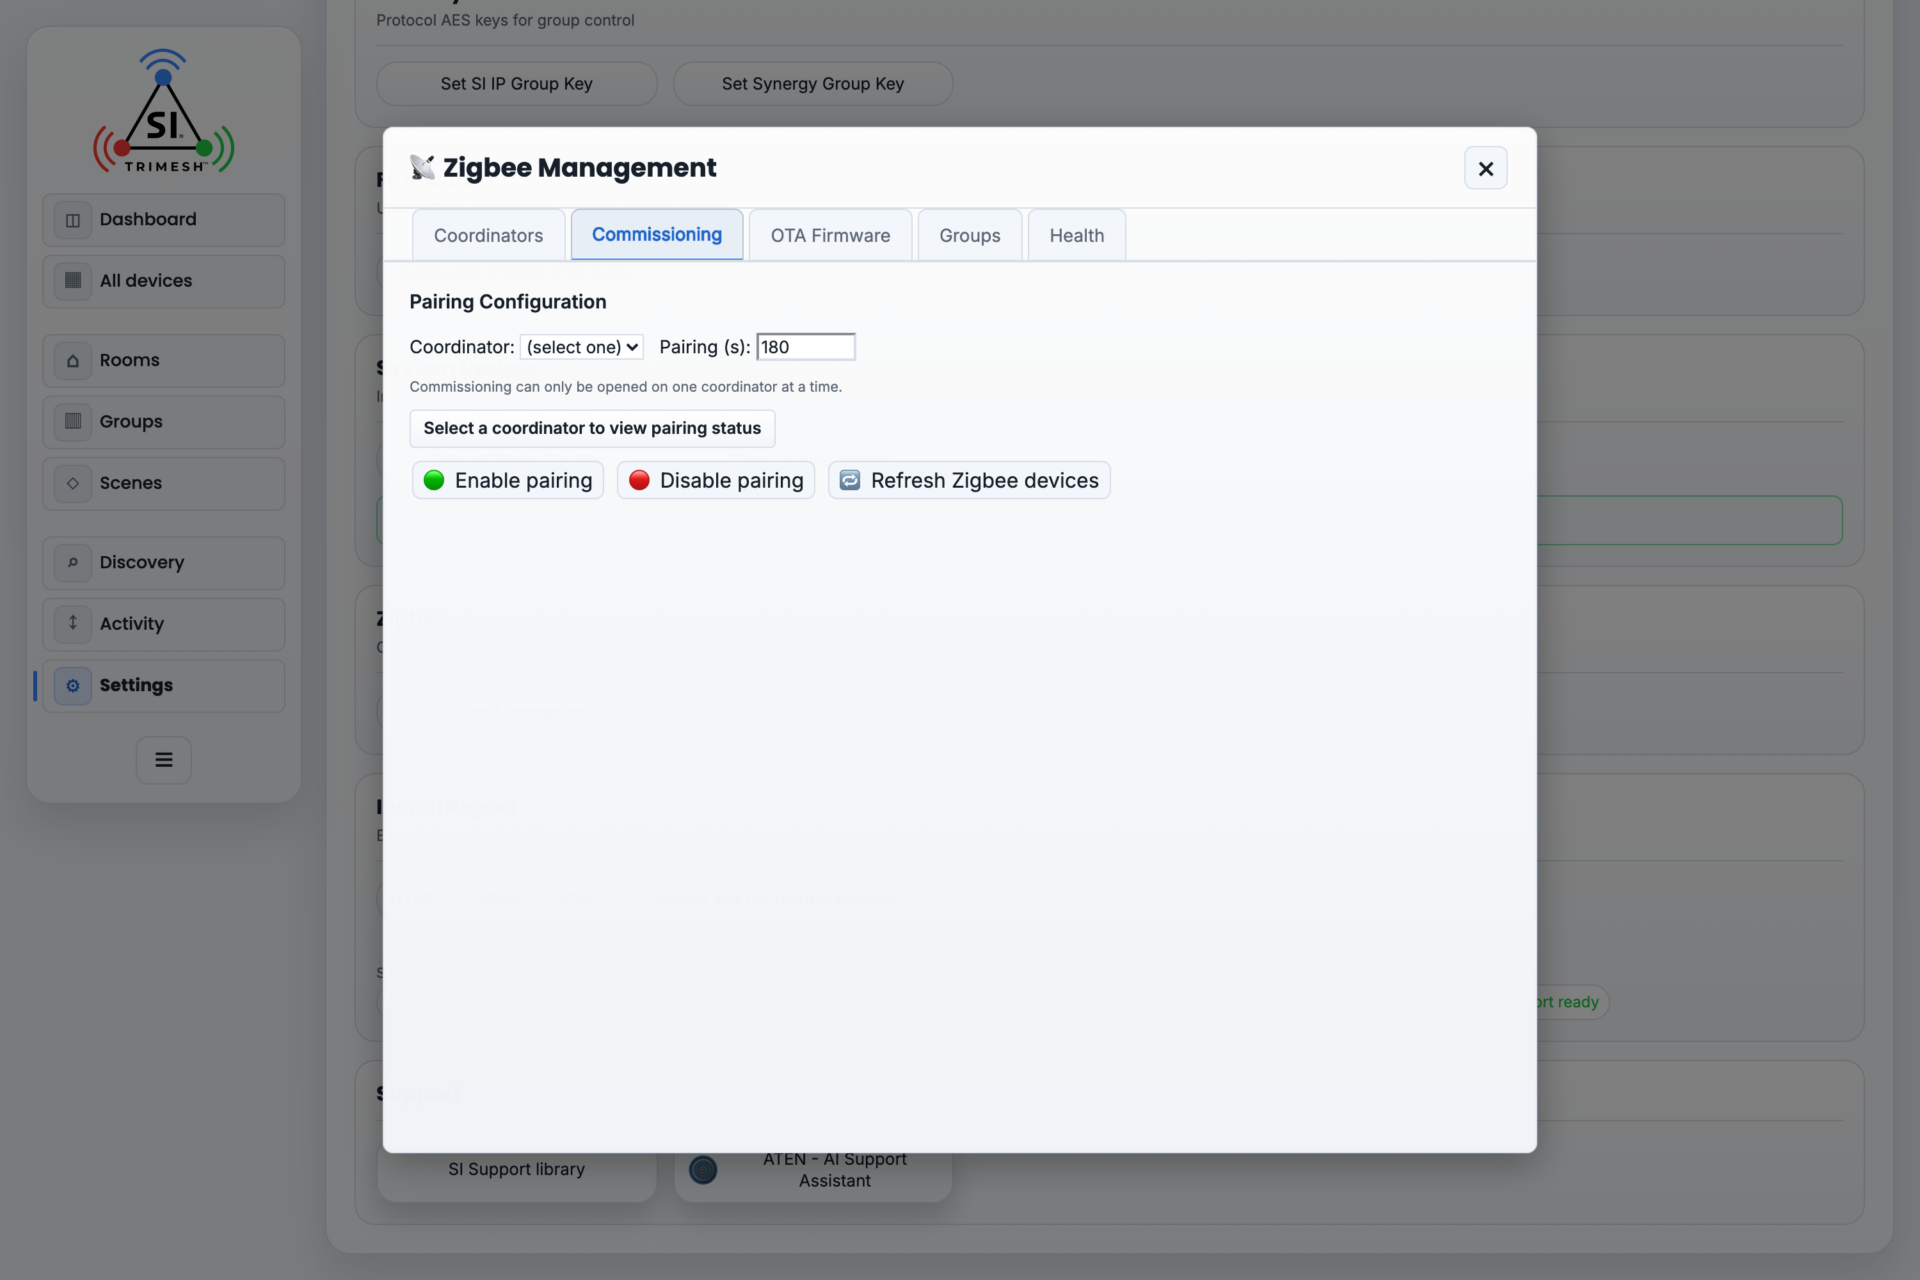
Pairing enabled, with the countdown running.
Removing a Zigbee device (Advanced view, in the device’s control panel): Remove device politely asks it to leave the network; the entry disappears once the device confirms. If the device is not answering, tick Force delete to erase it from the bridge immediately.
6.3 Wired SDN Motors #
Not in the initial release. The bridge’s software shows an SDN (wired 485) protocol, but driving wired motors directly from the bridge is a later feature. At launch, wired 485 motors are set up on the TRO.Y — see section 11.1, Combined Systems: TriMesh + TRO.Y, which covers the whole combined job: connecting the two boxes, importing the bridge’s shades, adding the wired motors and setting their limits on the TRO.Y.
6.4 SI IP and Synergy Devices #
SI IP and Synergy devices are discovered automatically on the local network and appear in Discovery with their IP addresses.
7. Working with Shades #
This is the section to hand to anyone who asks “why does my shade say 100 when it’s closed?”
7.1 How Positions Work #
Shade positions are a percentage from 0 to 100, where in a standard SI configuration 0 = fully open and 100 = fully closed — the bridge labels its own readout “% closed” beside the shade graphic. “Go to 30” means mostly open; “go to 90” means almost closed. Which way round a given Zigbee shade reports still depends on its Invert cover setting, whose tooltip spells out both mappings, so confirm it per shade during commissioning.
7.2 The Invert Setting — Fixing a Backwards Shade #
If a shade reports the opposite of reality — the app says open when the fabric is down — the position mapping is flipped for that motor. Fix it with the Invert cover toggle in the device’s control panel (Advanced view). Invert swaps which end of the 0–100 scale means open.
Two things matter here:
Invert changes how the position is reported and displayed. It does not physically reverse the motor. If the shade moves the wrong way when you press Up, that is rotation direction (section 7.5), not Invert.
Set Invert correctly on every motor during commissioning, before creating groups and scenes — a mixed batch (some inverted, some not) makes group moves look chaotic even though each motor is doing what it was told.
7.3 Saved Positions #
Motors that support saved positions can store presets the homeowner returns to; the bridge’s panel exposes eight slots (and the auto-spaced control accepts 0 to 8). In the device control panel:
Move-to buttons send the shade to a stored position.
Set buttons (Advanced view) store the shade’s current position into a preset slot — drive the shade where you want it, then press Set on the chosen slot.
Auto-spaced saved positions (Advanced view): tell the motor how many presets you want (0–8) and it distributes them evenly across the travel range — a fast way to give a homeowner quarter-point saved positions without setting each one by hand.
The shade graphic in the control panel draws a marker line for every stored position.
Note: not every motor supports saved positions (among Dan’s beta devices, SI SW motors expose them; some third-party Zigbee motors do not). The buttons appear only when the motor supports the feature.
7.4 Travel Limits #
Limits are the motor’s built-in “how far is safe” boundaries, normally set during shade installation.
In the device control panel (Advanced view):
Move (500 ms) Up/Down out-of-limit — nudges the motor briefly past its current limits, for recovering a mis-limited shade.
Set (with the Up/Down pair) — stores the current position as that end’s limit. The button reads Set on the release build (it was “Set limit” on the beta) and shows Setting… while it works; for five seconds afterwards the whole page stops accepting clicks.
SI SW motors additionally offer Set / Clear for the Upper / Lower boundary individually, and Delete both to wipe the limits and start over (confirmation required).
Warning: limit changes can drive fabric past its intended travel. Only adjust limits with eyes on the shade.
7.5 Motor-Specific Advanced Controls (Zigbee) #
The control panel shows an extra panel matched to the motor family (Advanced view):
SI SW motors – Rotation direction — Positive / Negative / Toggle, for motors that physically run backwards. – Jog — short up/down bump for identification and limit work. – Timed move — run the motor for an exact number of milliseconds. – Limits — see 7.4.
Somfy motors – Reverse direction — flips the motor’s rotation sense (confirmation required). – Step ignoring limits (ms) — a short timed move past the limits, for repositioning. (The percentage Step control is hidden in the release build.) – Store limit — save the current position as the upper or lower limit. – Leave network — asks the motor to un-pair cleanly. – Factory reset — full reset of the motor’s settings and Zigbee state (confirmation required; the shade must then be re-paired and re-limited).
7.6 Stopping a Moving Shade #
The Stop button in the device control panel (and Stop all shades on room cards) halts motion mid-travel. Note for integrators: there is no separate stop verb in the public WebSocket API — a stop is sent as a motor.move with a stop direction instead of a position. Confirmed on the release build.
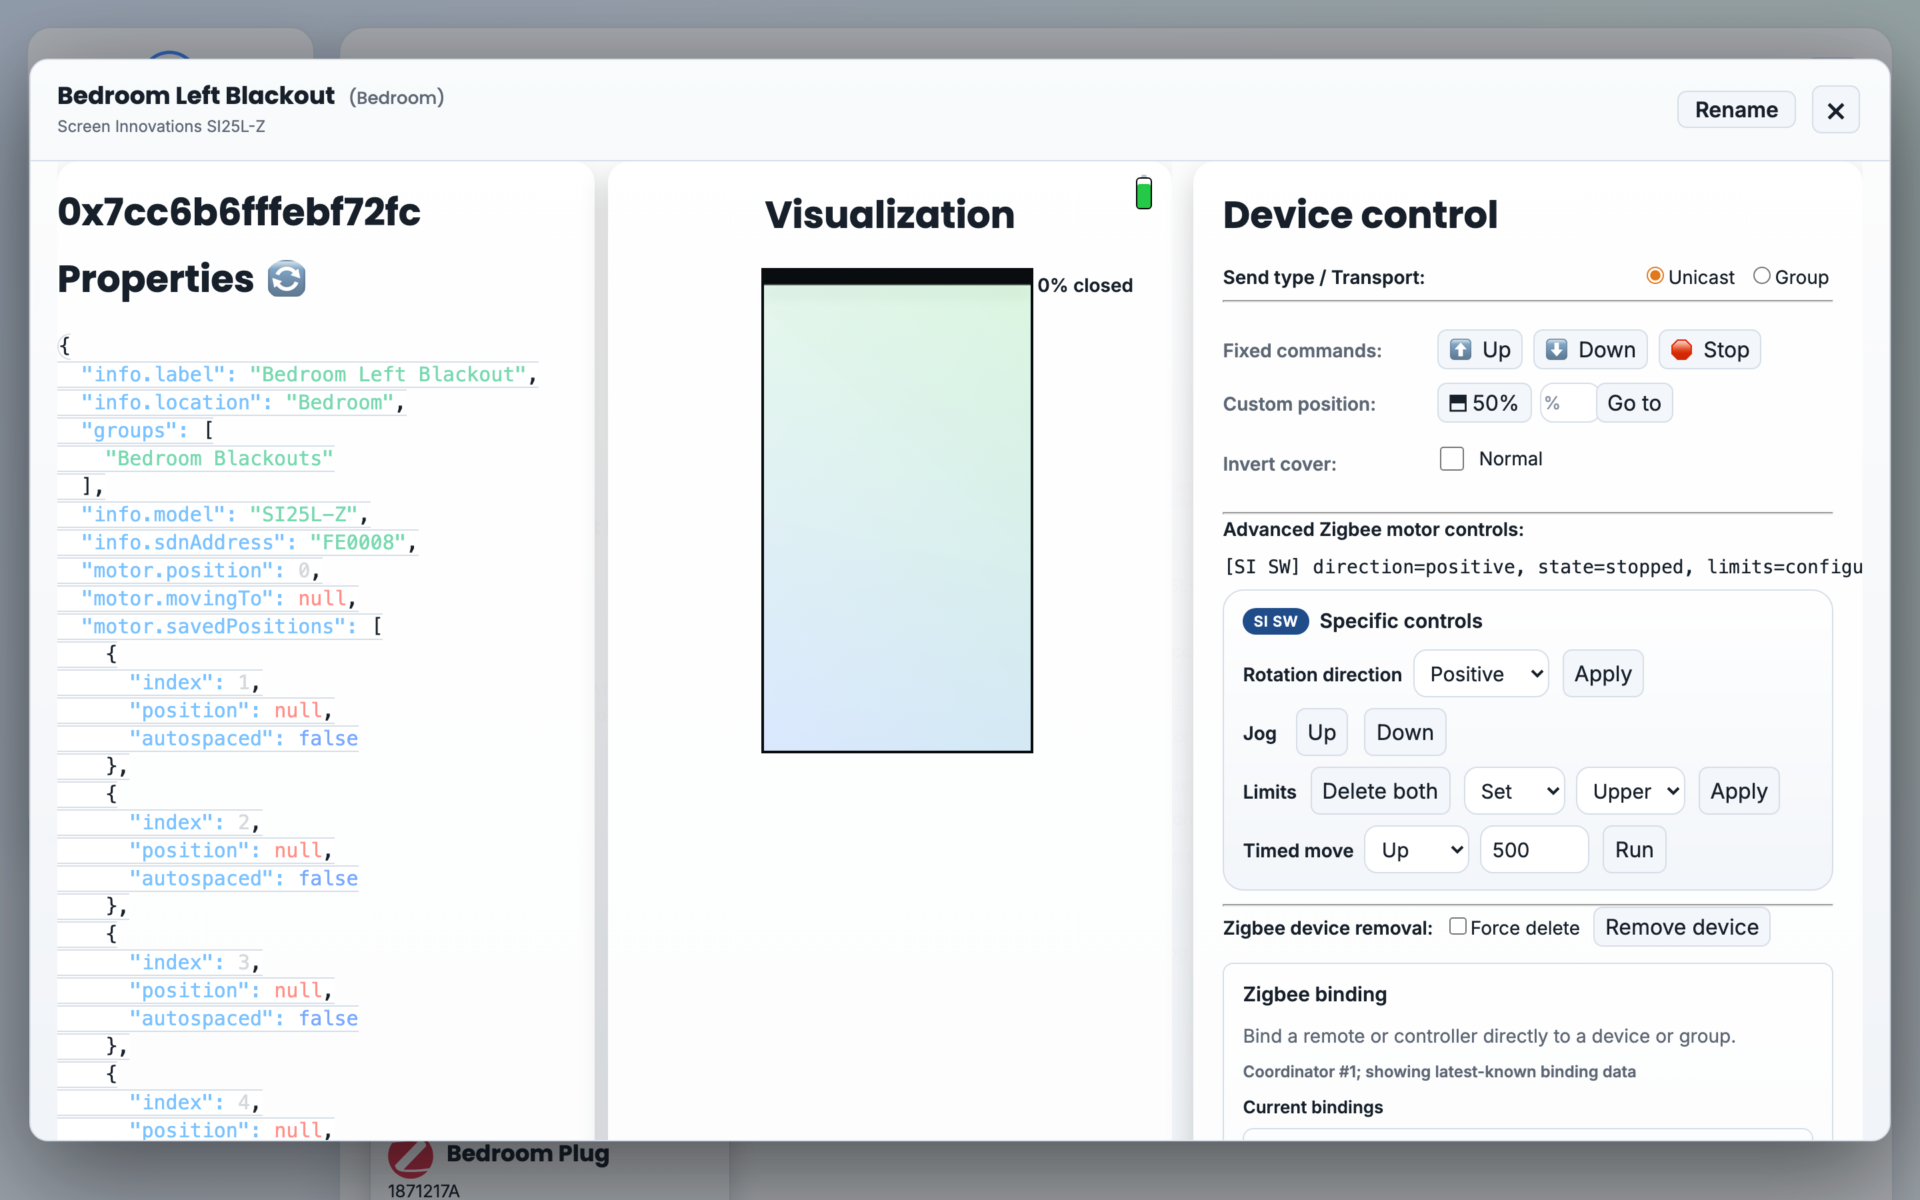
A shade’s control panel: properties, the position visualisation, and the controls for up, down, stop and a set position.
8. The Device Control Panel #
Tapping any device (from All devices, Discovery, Rooms, or the Dashboard) opens its control panel. What appears depends on the device type and view mode — the bridge only offers controls the device actually supports.
8.1 Header #
Device name, room, model, and protocol, plus Rename. Renaming here updates the device’s stored label everywhere (bridge, API, and control-system integrations).
8.2 Properties #
A live, plain-text readout of everything the bridge knows: position, battery, signal quality (LQI), firmware version, group memberships, and more, with a refresh control. When calling support, this panel is the device’s vital signs.
8.3 Visualization #
Shades — a drawn shade showing live position, target position while moving, saved-position markers, and an activity light that flashes when frames arrive from the device.
Plugs/switches — an on/off state card (with energy metering readouts when the plug reports them, e.g. “Energy this month”).
Lights — state, brightness, color, and color temperature.
Sensors — a card per reading (temperature, humidity, occupancy, contact, illuminance, pressure, vibration, water leak, smoke, carbon monoxide, battery).
8.4 Controls #
Motors: Up / Down / Stop, 50%, go-to-percentage, saved positions, and the advanced panels from section 7.
Switches: On / Off / Toggle.
Lights: On / Off, brightness slider, color picker, color temperature (the bridge enforces the lamp’s supported range).
Identify (jog or LED blink) on everything that supports it.
8.5 Send Options (Advanced view, protocol-dependent) #
For IP-protocol devices, installers can choose the transport (TCP+TLS, UDP+AES unicast, UDP+AES broadcast) and the send type (Unicast to this device, Group, or Broadcast). Defaults are correct for normal use; these switches are diagnostic tools.
For Zigbee coordinators, a broadcast panel can command all routers or all devices on the mesh at once (all shades up/down/stop, all plugs on/off) — a commissioning convenience with an appropriate warning before use.
8.6 Advanced Administration (Advanced view) #
Commissioning / config API unlock — a password field that unlocks protected configuration commands on SI IP devices (TCP+TLS only).
Firmware update (bridge → motor) — starts a motor firmware update using an image previously uploaded in Settings → Firmware (SI IP), or via OTA for Zigbee (section 9.3).
Raw JSON frame / Raw MQTT frame — power-user consoles that show exactly what will be sent and allow hand-crafted frames. For SI support use.
Zigbee binding — links a Zigbee remote directly to a device or group, so the remote keeps working even if the bridge is offline. Choose the source endpoint, the destination (device or group), and the commands to bind. The list is headed Clusters in Advanced view and Commands in Simple view. Nothing is pre-ticked for a device with no bindings yet — tick the commands you want, or Bind does nothing. Existing bindings appear as individual badges, each removable on its own. Battery remotes need waking just before binding — tap a button, or the PROG/RESET button once, as the panel advises.
Zigbee device removal — see section 6.2.
Device setup (Advanced view, Zigbee devices) — Re-interview asks the bridge to relearn what a device is and what it can do; Re-configure rewrites its reporting setup. These are the first things to try on a device that joined but behaves oddly. Wake a battery device first, and note the panel’s own caution that reconfiguring does not work on every device.
Network tables (Advanced view, Zigbee devices) — Read neighbour table for any device, plus Read routing table for routers and coordinators. Useful when a shade’s signal looks fine but its path does not.
Battery-powered devices now show a battery gauge in both the visualization and the control column.
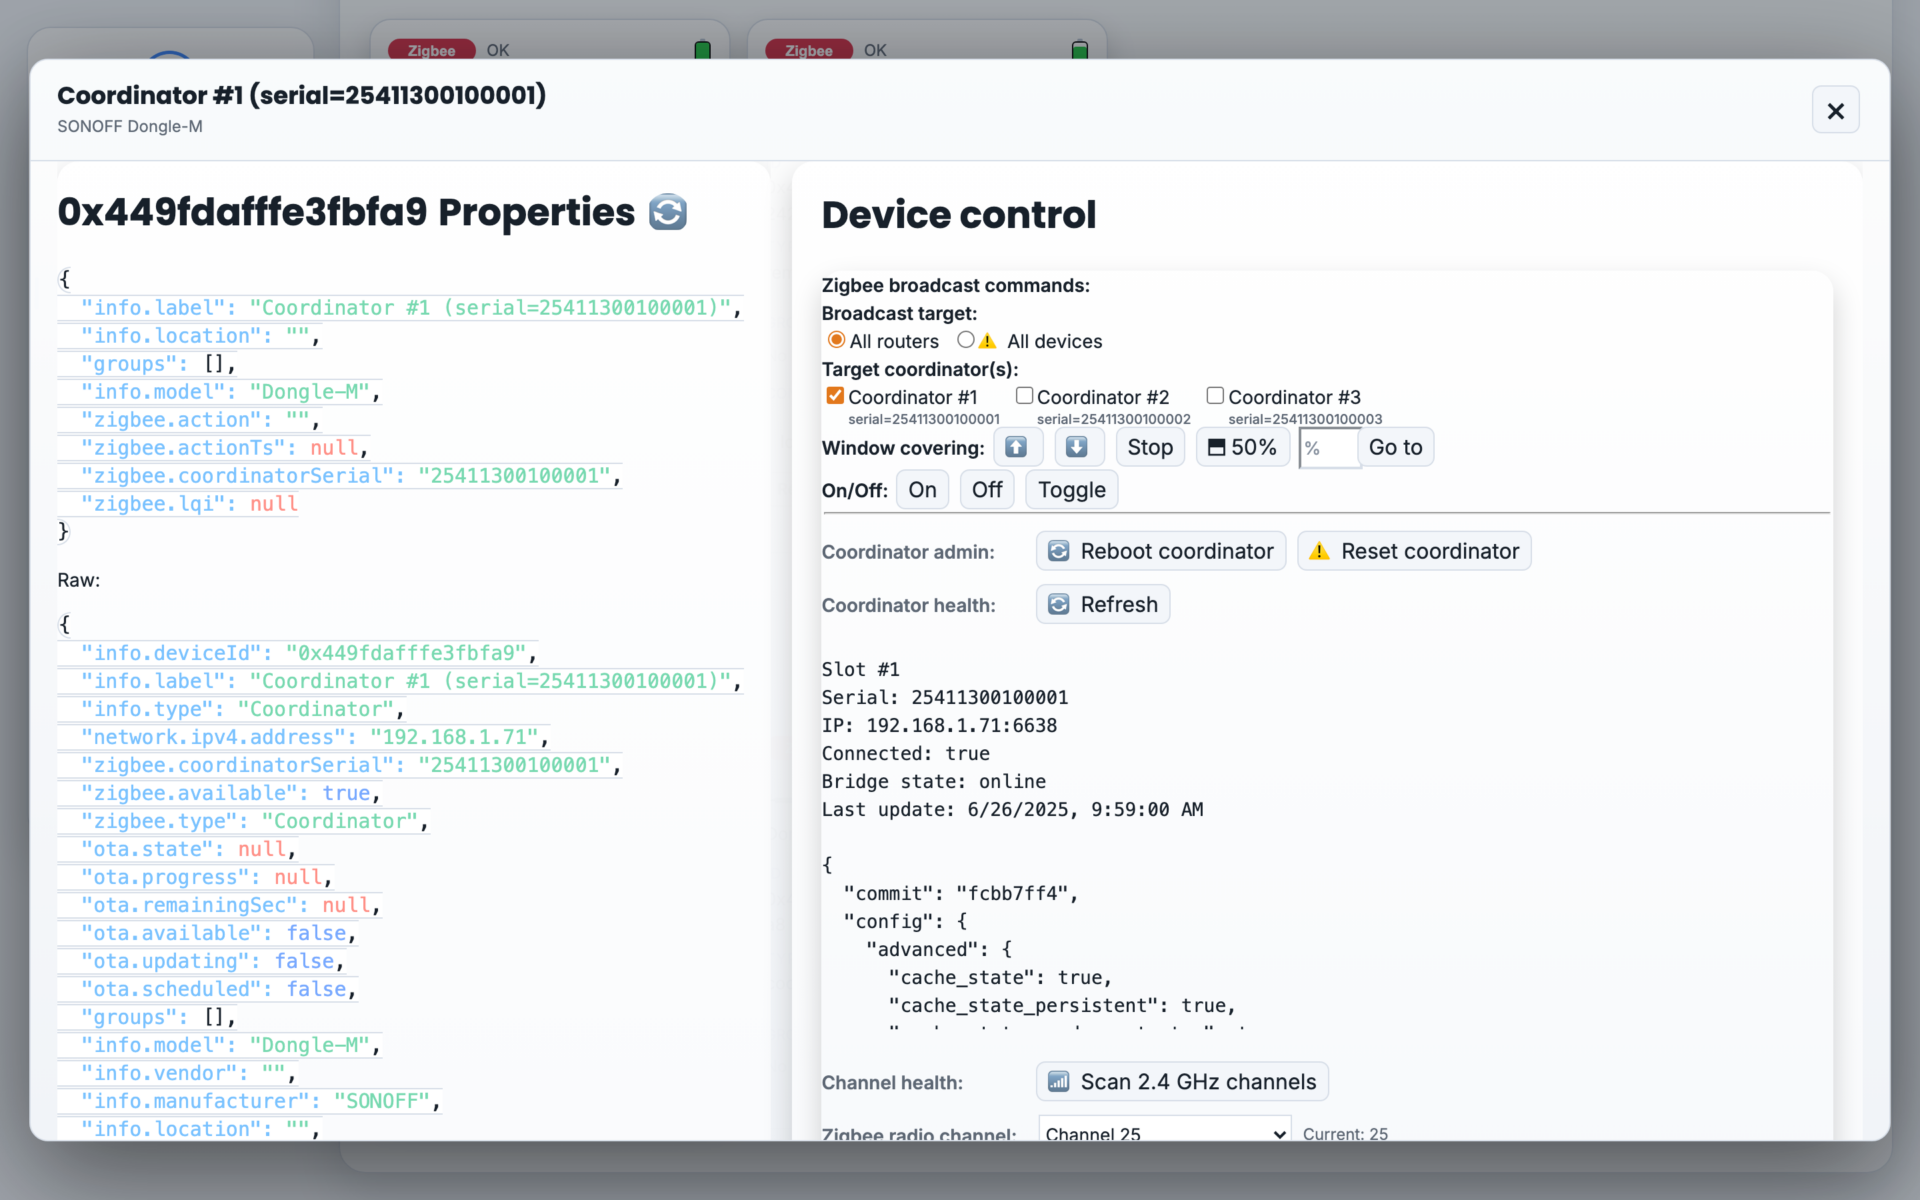
A coordinator’s control panel, with broadcast commands, coordinator health, the channel tools and the network map controls.
9. Zigbee Management Reference (Advanced view) #
Settings → Zigbee Management opens a five-tab console. Sections 6.1 and 6.2 covered Coordinators and Commissioning; the rest:
9.1 Coordinator Health #
Live status for each slot: whether the bridge is connected to the coordinator, plus mesh statistics. Also available per-coordinator from its control panel, with a refresh button.
9.2 Channel health: the 2.4 GHz scan (the spectrum analyzer) #
A note on names in this section: buttons are named by their words. On screen most of them also carry a small icon to the left of the words. The wording in quotation marks is exactly what the bridge puts on screen, so you can match it while you are standing in front of it.
Words used on these screens #
Word | What it means here |
|---|---|
Coordinator | The Zigbee module inside the bridge that runs one Zigbee network. The bridge has three slots, #1, #2 and #3, and each one keeps its own scan and its own channel. |
Channel | A named slice of the 2.4 GHz band. Zigbee uses channels 11 to 26. House Wi-Fi uses its own channel numbers over the same band. |
Energy | How much signal the coordinator measured in a slice of the band. It is a measurement, not a verdict. |
Interference | Two systems using the same slice of the band at the same time, so they talk over each other. |
Router | A mains-powered Zigbee device that relays for other devices. |
End device | A device that does not relay, usually battery powered. It hangs off one router or off the coordinator, called its parent. |
LQI | Link Quality Indicator. A number from 0 to 255 that one device reports about how well it hears another. Higher is better. It is that device’s own opinion, and the two ends of a link often report different numbers. |
dBm | A signal level. It is a negative number, and closer to zero means louder. -72 is louder than -91. |
9.2.1 What the tool is, and where it lives #
Each coordinator has its own control page, and that page carries two separate diagnostics.
Channel health is the 2.4 GHz scan, the spectrum analyser. It answers one question: is anything else using the part of the 2.4 GHz band that this coordinator’s Zigbee network sits in? It then lets you move the network to a different channel.
The network map is the companion tool further down the same page, covered in section 9.6. It answers a different question: how is the mesh built, and which device is relaying for which. It never touches channels.
Both give you a snapshot taken at a moment in time. Neither is a live meter. See 9.2.10.
To reach them:
Open the menu button at the top right of the header. Set “View:” to “Advanced”. The choice is stored in that browser, so it holds until someone changes it back.
Go to “Discovery”.
Find the coordinator’s row in the device list. It reads “Coordinator #1 (serial=…)”. Press “View” on that row.
The page that opens is headed “Device control”. Work down it past “Zigbee broadcast commands:”, “Coordinator admin:” and “Coordinator health:” until you reach “Channel health:”.
In Simple view the “View” button on a coordinator row does nothing at all, so the page never opens and the scan button is nowhere to be found. That is the Advanced-view gate doing its job, not a fault. The same gate applies to the map’s “Open graph” button: in Simple view it does nothing when pressed. If a dealer reports a missing Scan button, check “View:” first.
You are scanning the coordinator you opened. If the bridge has more than one coordinator bound, open each one in turn.
9.2.2 Running a scan and watching it work #
Press “Scan 2.4 GHz channels”.
The button greys out, its label gains an hourglass, and 15 seconds later it comes back to life. That 15 seconds is a double-press guard, not the length of the scan. The button returning means nothing about whether the scan finished. There is no progress bar and no percentage, and the software never states a duration — but measured on a live three-coordinator system the report arrived in about five seconds, comfortably inside the guard.
Two lines in the monospaced text block at the bottom of the section are the real progress display:
“Scanning: true” means a scan is running now.
“Scan timestamp:” is the date and time of the report that is currently on screen. When that line changes, the new report has landed.
If the timestamp has not moved after a fair wait, press “Refresh” on the “Coordinator health:” line just above. That re-asks the bridge for coordinator health, channel health and the coordinator list. Reloading the page, or closing and reopening “Zigbee Management”, re-asks for the same three.
One trap worth knowing. If this coordinator has been scanned before, the previous chart, tiles and verdict sentence all stay on screen while a new scan runs. Nothing dims or clears. Only “Scanning: true” and an unchanged “Scan timestamp:” tell you that you are looking at the older picture. If nothing has ever been scanned on this coordinator, the text block simply ends with “Scan in progress…” and no chart appears yet.
Two things can appear instead of a scan:
“Select a Zigbee coordinator first.” — the page does not have a coordinator in focus. Go back to “Discovery” and press “View” on the coordinator row, not on a shade.
“Backend communication error.” — the browser has lost its connection to the bridge. Nothing was sent. Reload the page.
The bridge’s “Activity” list records the request as “Scan radio channels”. That is how you confirm a press actually registered.
9.2.3 Reading the result #
Once a report exists, the panel above the text block fills in with four things: two tiles, one sentence, two tick boxes, and the chart.
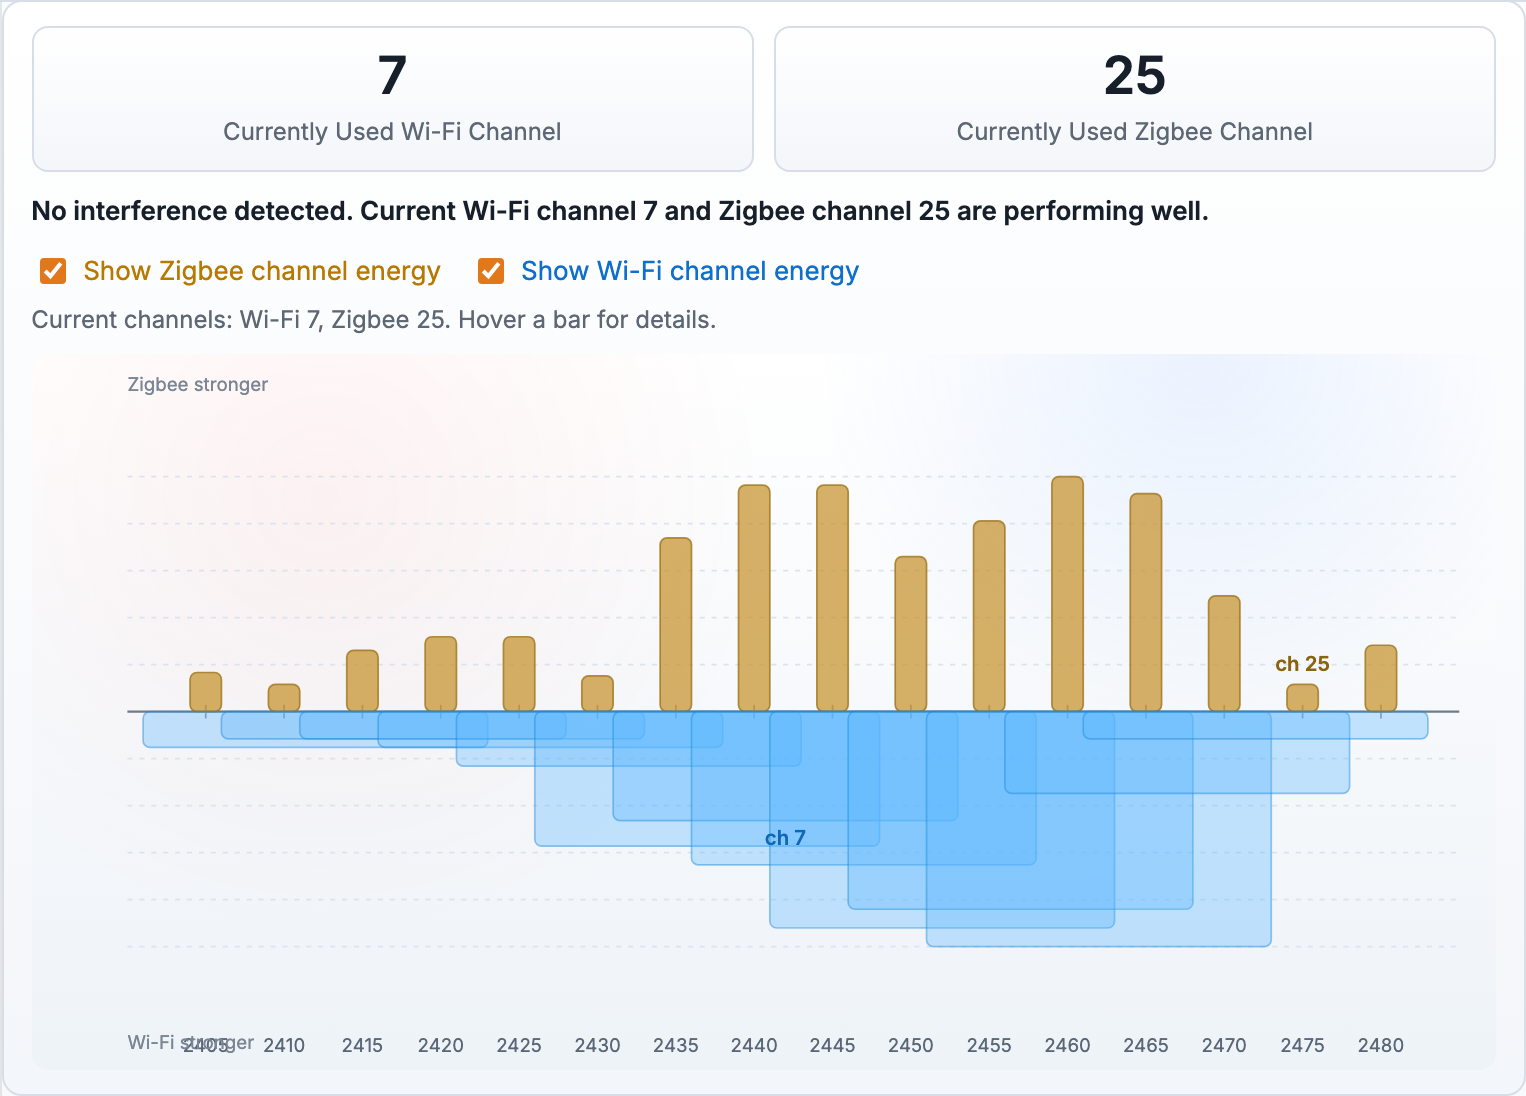
The two tiles. Two large numbers, captioned “Currently Used Wi-Fi Channel” and “Currently Used Zigbee Channel”. Either reads “n/a” when the report did not carry that number. These are the two numbers to write on the commissioning sheet. An “n/a” in the Wi-Fi tile is a missing observation, not a clear band.
The verdict sentence. One bold line under the tiles. There are exactly three wordings, and the channel numbers are filled in live.
On screen | What it means | What to do |
|---|---|---|
“Potential interference detected. Wi-Fi channel W and Zigbee channel Z may need attention.” | The bridge found something worth a second look on or near the channel in use. Note the wording it chose: potential, and may. | Read the chart. If a wide Wi-Fi block sits over the Zigbee channel in use, consider moving the Zigbee channel, or ask the network installer to move Wi-Fi. |
“No interference detected. Current Wi-Fi channel W and Zigbee channel Z are performing well.” | Nothing met the bridge’s own test at the moment of the scan. | Record it and move on. It is a statement about that moment, not a guarantee for the life of the job. |
“Scan complete. Compare Wi-Fi and Zigbee energy around the current Zigbee channel Z.” | The scan ran but came back without a verdict. This is the honest “measured, not judged” case. | Read the chart yourself, around the channel it names. |
(the line is empty) | No report yet, or this coordinator is not a supported model. | See 9.2.5. |
The verdict is the bridge’s call, not the app’s. The rule behind it lives in the bridge and coordinator firmware. There is no threshold published in the app, so this manual does not quote one.
The two tick boxes. “Show Zigbee channel energy” and “Show Wi-Fi channel energy”, both ticked when the page loads. Untick one to take that colour off the chart. The label colours are the chart’s legend: the amber label matches the amber bars, the blue label matches the blue ones. Untick both and the chart clears and the line above it reads “Enable at least one series to display the scan chart.” These boxes are not remembered; reloading the page puts both back on.
Unticking one colour re-scales the other, so the remaining bars change height even though the data did not. See below.
9.2.4 Reading the chart #
This is the part that repays a minute of study.
The layout. One horizontal line across the middle. Zigbee energy grows upward from that line in amber, Wi-Fi energy grows downward in translucent blue. The chart labels this for you: “Zigbee stronger” sits at the top left and “Wi-Fi stronger” at the bottom left. Wi-Fi is drawn last, so blue washes over amber where the two overlap. That overlap is the whole point of the picture.
The bottom axis is frequency in MHz, not channel number. It is tick-marked and labelled every 5 MHz, from 2405 to 2480, and normally spans 2400 to 2485 MHz. It widens if the scan reports a sample outside that span.
Each bar is one scanned channel, drawn at its true width in MHz. So a Wi-Fi bar is a wide block and a Zigbee bar is a narrow slice. This is why a single Wi-Fi channel sits across several Zigbee channels at once: Zigbee channels 11 to 26 are spaced 5 MHz apart and each is narrow, while a Wi-Fi channel occupies a much wider block of the same band. You are not comparing two lists of channel numbers. You are comparing two sets of blocks on one ruler, and looking for where they land on top of each other.
The channel in use is labelled. The Zigbee bar that matches the coordinator’s current channel gets a bold “ch 15” label printed above it. The Wi-Fi bar that matches the current Wi-Fi channel gets the same treatment below it. Those two labels are where your eye should go first.
Bar height is relative, not a signal level. This is the one thing dealers misread. Each colour is scaled against its own highest and lowest reading in that one scan:
bar height = (this channel’s energy − the lowest energy in its own colour this scan) ÷ (the highest − the lowest in that colour) × full height
Full height is 138 px in a 420 px chart, and nothing draws shorter than 16 px. So the loudest thing in each colour is always drawn at full height and the quietest is always drawn short, whether the house is quiet or busy. If a colour has only one sample, or all its samples are equal, every bar in that colour draws at just over half height and tells you nothing about level.
Two consequences to teach:
A chart of tall amber bars does not mean loud interference. It means those were the loudest of what was seen on that pass.
Heights are comparable only inside one colour, inside one scan. Never compare amber against blue by height, and never compare two scans by height.
The ten dashed lines, five above and five below, are even spacing marks. They carry no values. Do not read a level off them.
How to read it in three moves.
Find the amber bar labelled “ch N”. That is where the shades are.
Look straight down from it. Is a wide blue block sitting across the same part of the ruler? If yes, the shade network and the house Wi-Fi are sharing spectrum.
Scan the rest of the ruler for a stretch that is clear of blue, and check which of the recommended channels lands in it. Then act as in 9.2.6.
Getting the real numbers. Above the chart is a one-line readout. At rest it reads “Current channels: Wi-Fi 6, Zigbee 15. Hover a bar for details.” with the live numbers filled in. Point at any bar and the line becomes, for example, “Zigbee channel 15 • energy -82 dBm • 2425-2430 MHz” or “Wi-Fi channel 6 • energy 41 • 2426-2448 MHz”. Resting the pointer on a bar also brings up the same sentence as a pop-up tooltip.
Read the units carefully:
Zigbee energy is in dBm. More negative is quieter. -91 is quieter than -72.
Wi-Fi energy is printed with no unit at all. Treat it as a relative reading from this coordinator, not as dBm, and do not compare it against the Zigbee numbers. On some coordinators the report tags energy as a score out of 100, in which case the pop-up tooltip prints “/ 100”.
The MHz range is the most useful part. Two bars whose ranges overlap are physically on top of each other. That is how you prove overlap rather than eyeballing it.
On a touch tablet there is no hovering, so use the top-five lists in the text report instead.
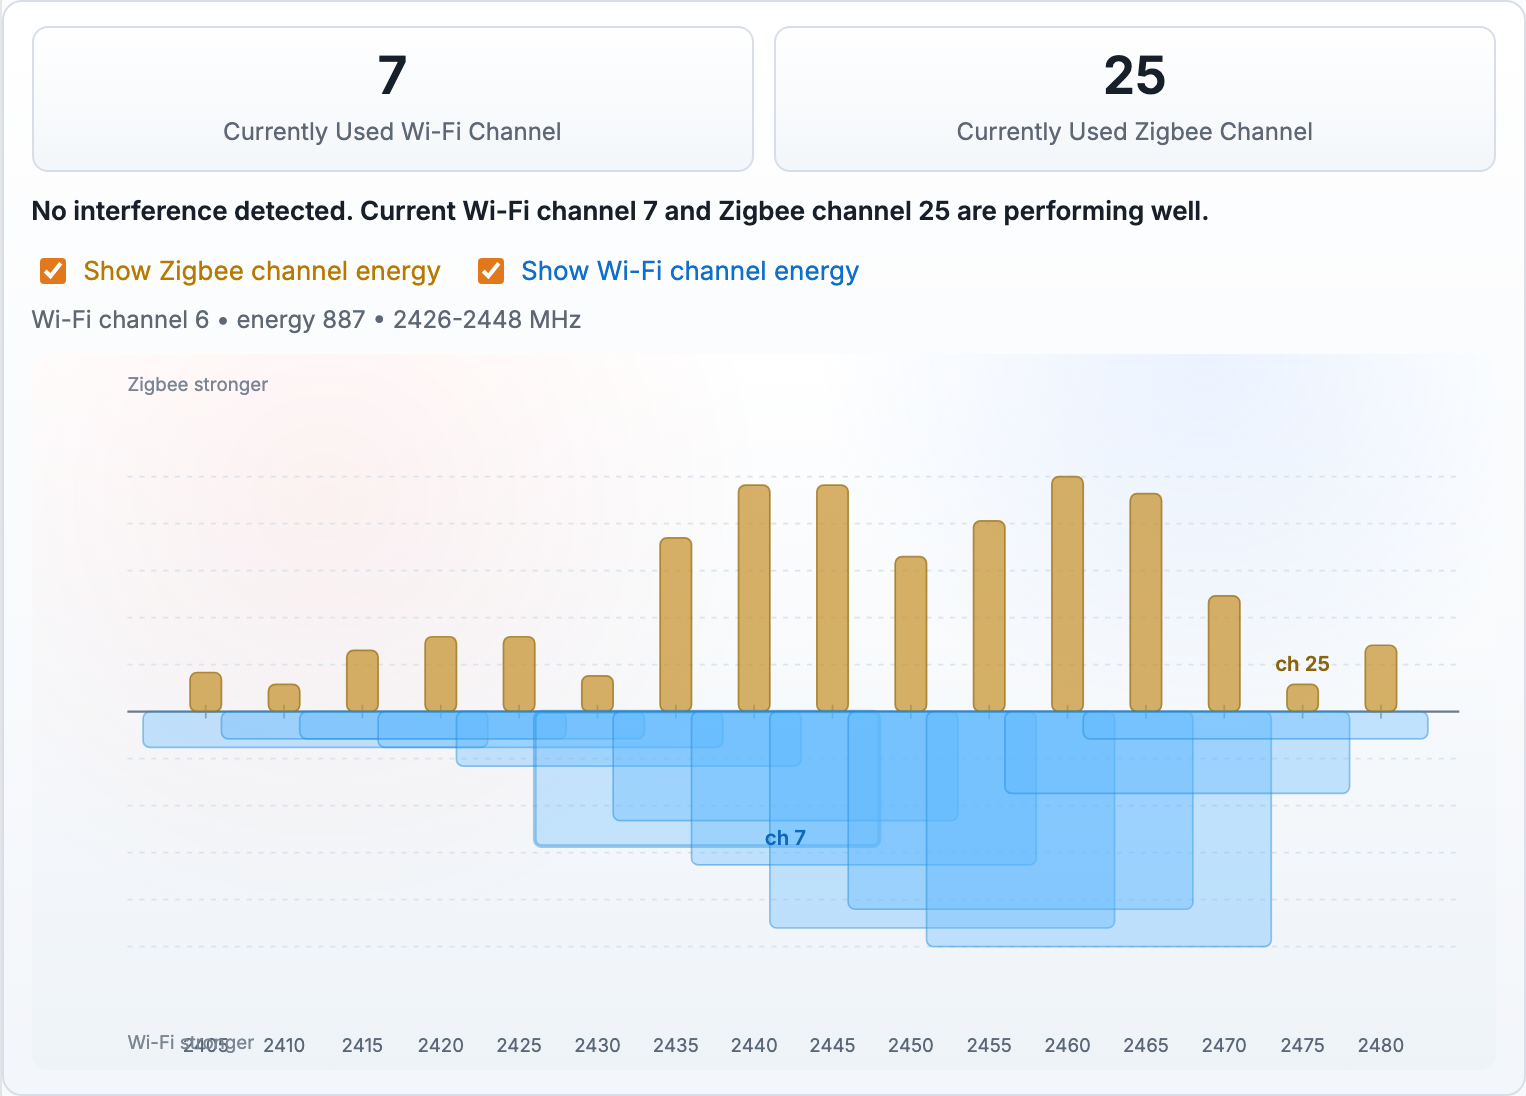
A real scan on a live system: the two tiles, the verdict sentence, the tick boxes, the hover line and the chart.
The hover readout, giving a bar’s channel, energy and MHz range.
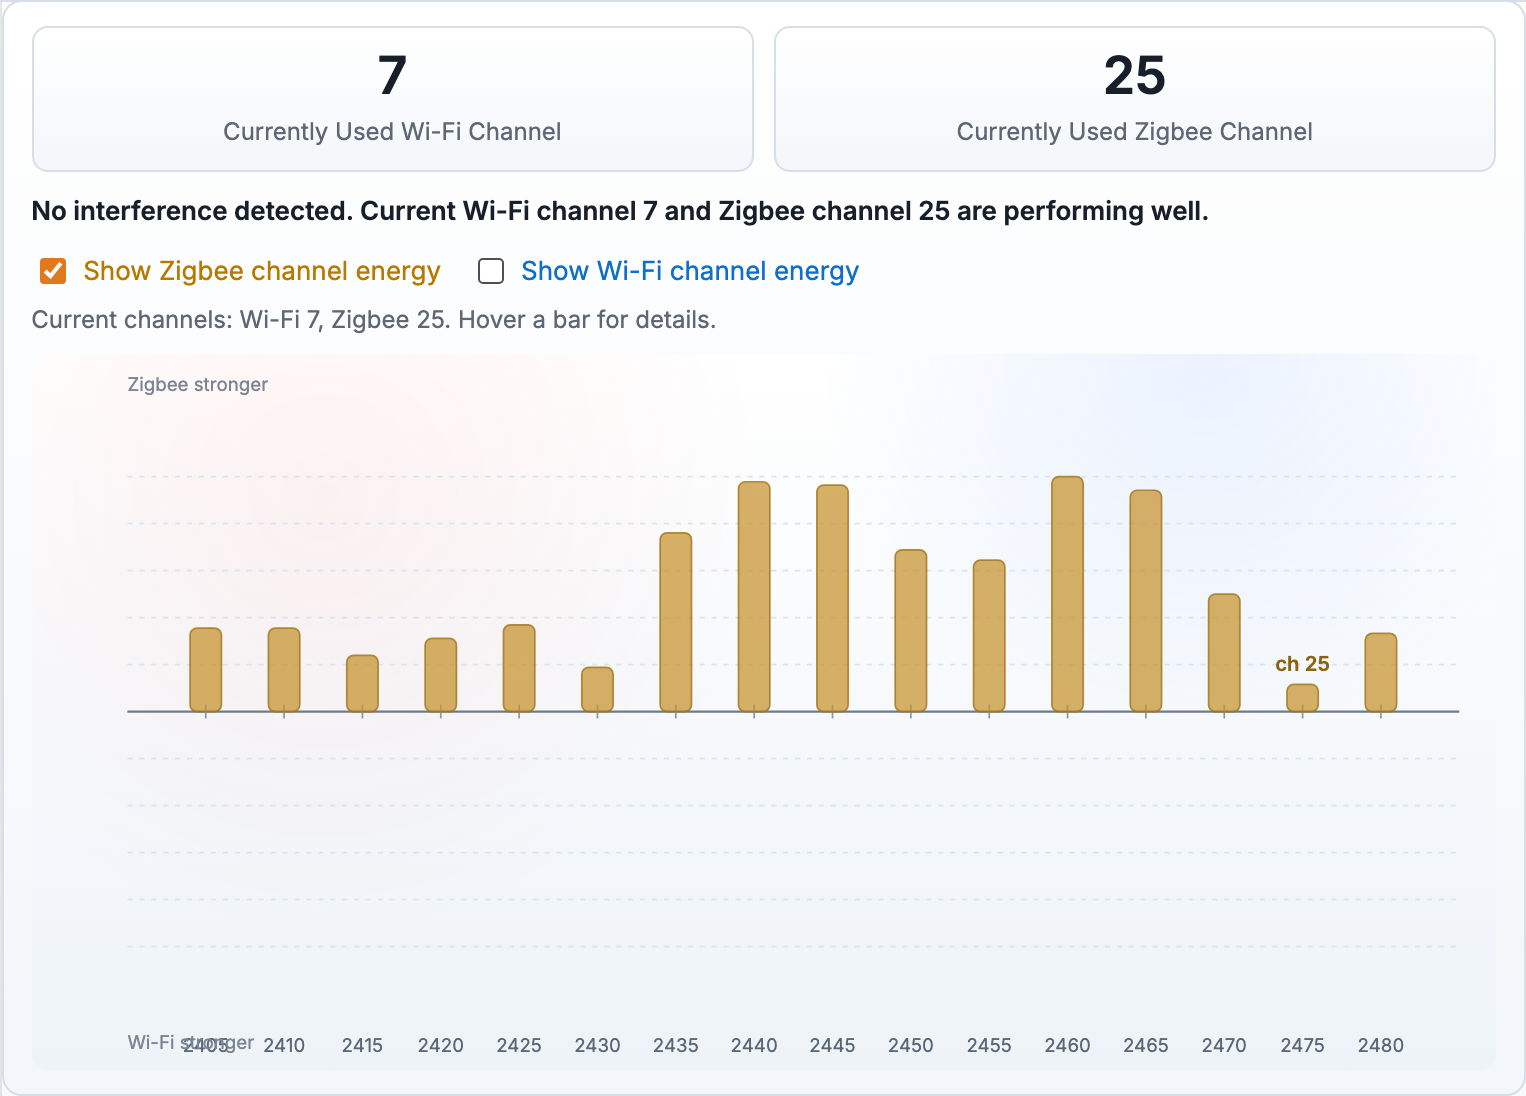
The same scan with “Show Wi-Fi channel energy” unticked. Note the remaining bars re-scale — the data did not change.
9.2.5 The text report, line by line #
The monospaced block at the bottom of the section is the one to photograph and attach to a support case. It carries the model, the address, both channels, the verdict and the time, on one screen.
Before anything is known it reads “(No channel-health data yet)”. Otherwise it always opens with these five lines, in this order:
Line | Reading it |
|---|---|
“Supported: true” / “false” | Whether this coordinator model can scan at all. |
“Scanning: true” / “false” | Whether a scan is running right now. |
“IP: …” | The coordinator’s address on the network, or “n/a”. |
“Model: …” | Maker and model, for example “SONOFF Dongle-M”. Shows “? ?” when unknown. |
“Last update: …” | When the bridge last refreshed this coordinator’s channel-health record. |
A “Last error: …” line follows when the bridge has one to report. That text comes straight from the bridge and can be technical. Quote it verbatim to SI Support.
The block then either continues to the report, or ends with one of the four hold-up messages in the next table.
When a report exists, the block continues after a blank line with:
Line | Reading it |
|---|---|
“Current Wi-Fi channel: 6” | The Wi-Fi channel the coordinator observed at scan time. |
“Current Zigbee channel: 15” | The channel the Zigbee network was on at scan time. |
“Interference detected: true / false / n/a” | The bridge’s verdict. “n/a” means it measured but returned no verdict, and matches the “Scan complete. Compare…” sentence. |
“Scan timestamp: …” | When the scan itself completed. This is the line that tells you how old the picture is. |
“Top Wi-Fi energy: ch6=41, ch1=33, …” | Up to five Wi-Fi channels, strongest first, values as reported with no unit. |
“Top Zigbee energy: ch15=-72, ch16=-78, …” | Up to five Zigbee channels, loudest first. Remember these are negative: the first entry is the loudest, so -72 is louder than -91. |
Both top-five lines are left out when that colour has no samples. They are a ranking of the five strongest only; the chart holds every sample.
Timestamps are formatted by the browser, using the tablet or laptop clock. A device with the wrong time prints the wrong scan time.
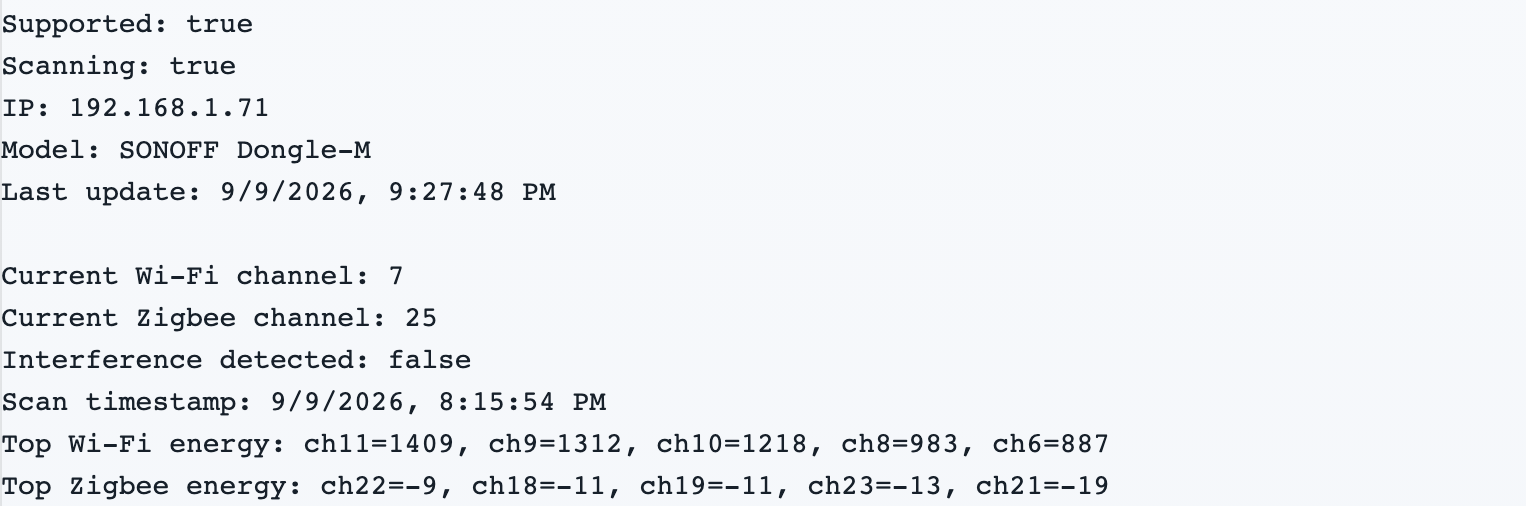
The text report from a live scan. This is the block to photograph for a support case.
9.2.6 When the scan cannot run yet #
These four messages appear in the text report, in this order of priority. Only one shows at a time, and each one holds back everything below it.
Message on screen | What it means | Next action |
|---|---|---|
“Coordinator binding or IP is not available yet.” | The bridge does not yet have a serial and an address for this slot. | Bind the slot, or wait for the coordinator to come back on the network, then press “Refresh”. |
“This feature is only available on SONOFF Dongle-M and SMLIGHT SLZB-06 series coordinators.” | This coordinator model does not carry the scan function. | The scan is not available on this hardware. Use the network map and the usual RF checks instead. |
“Coordinator API credentials are not configured yet.” followed by “Set a coordinator API password in Zigbee > Coordinators > Coordinator API credentials before scanning.” | The scan needs the coordinator’s own web API password and none is saved for this slot. | Save the password, see 9.2.7, then scan again. |
“No scan report yet.” or “Scan in progress…” | Nothing has ever been scanned on this coordinator. | Press “Scan 2.4 GHz channels”. |
Note that the “Scan 2.4 GHz channels” button is still live even when the model is not supported. Pressing it sends the request anyway, and the refusal comes back on the “Last error:” line.
9.2.7 Coordinator credentials, and what actually needs them #
The spectrum scan is the only control in this area that needs the coordinator’s own API password. Changing the Zigbee channel does not, and the network map does not.
Whether a password is needed is decided by the bridge per coordinator. When the bridge does not say, the app assumes a password is needed only for a SONOFF Dongle-M. An SMLIGHT SLZB-06 typically scans without one.
Credentials are saved in Settings → Zigbee → “Zigbee Management” → the “Coordinators” tab → “Coordinator API credentials”. That section only appears when a supported coordinator is bound. Its own hint reads: “Advanced: SMLIGHT web API credentials are optional. SONOFF uses the fixed username admin.”
Each slot gets a row with its serial, an “API username (SMLIGHT)” field, an “API password” field with a reveal button, “Save”, and “Auto-provision”.
On a SONOFF Dongle-M the username field is hidden, because the username is fixed, and the “Auto-provision” button is offered. It generates and stores a password for you, then reports “Coordinator API credentials auto-provisioned for slot #N. The new password has been filled in.”
On an SMLIGHT SLZB-06 the username field appears and is optional.
9.2.8 Choosing and changing the channel #
Just above the results panel is the row “Zigbee radio channel:”, a dropdown, and a small “Current: …” caption. The dropdown is only usable in Advanced view.
The dropdown has two groups:
“Recommended Channels (ZLL)”: “Channel 11”, “Channel 15”, “Channel 20”, “Channel 25”.
“Other channels”: the remaining twelve, 12, 13, 14, 16, 17, 18, 19, 21, 22, 23, 24 and 26.
Those four recommended channels are a fixed list built into the app. The tool does not recommend a channel for this house. It does not rank channels, does not score them, and does not grey out a channel just because the chart shows energy on it. Choosing is your read of the chart, and the four recommended channels are where to look first.
The caption tells you how much to trust the number next to it:
Caption | Meaning |
|---|---|
“Current: 15” | The coordinator itself reports channel 15. Trustworthy. |
“Current: 15 (from latest scan)” | The app could not read the channel out of the coordinator’s configuration, so this is what the last scan observed. Treat it as an observation, not a settings read-back. |
“Current: unknown” | Neither source is available. Press “Refresh” on “Coordinator health:”, or wait for the coordinator to report in. |
Changing the channel is the one control here that changes the installation. Pick a different channel and a confirmation box appears with exactly this text:
Change Zigbee coordinator #1 to channel 20?
This will adjust its configuration and restart it. Some devices may rejoin the updated Zigbee network automatically, but not all devices may do so. You may need to re-pair devices afterward.
Take that at face value. The coordinator restarts, and some devices may need re-pairing. Do it before you hand the job over, not after. Cancel and the dropdown snaps back to the previous channel.
Two refusals can appear instead, and both also snap the dropdown back: “Select a Zigbee coordinator first.” and “Select a Zigbee channel between 11 and 26.” Re-picking the channel already in use does nothing at all.
After you confirm, the dropdown greys out for 3 seconds. That is a press guard, not the time the coordinator takes to come back.
Then re-scan. As soon as the bridge accepts the change, the app writes the new channel into the readouts and into the cached scan report, so the report on screen will claim the new channel while the chart still shows what was measured on the old one. A fresh scan is the only way to make those two agree, and it is also how you confirm the new channel is genuinely quieter.
9.2.9 What this tool cannot tell you #
How long a scan takes. The app never states a duration. Watch “Scanning:” and “Scan timestamp:” instead. The “up to 3 minutes” wait belongs to the network map, not to this scan.
What counts as interference. The rule lives in bridge and coordinator firmware. Do not quote a threshold to a customer, and do not invent one.
Which channel to move to. It shows you the band. You choose.
Whether a link is reliable. Energy is not delivery. Prove a fix by driving the shades, up, stop, down, from both the app and the wall control.
What the customer’s router is set to. The Wi-Fi channel shown is what the coordinator observed, not a reading of the router’s configuration.
Anything happening now. Every number is from the scan. A chart on screen can be days old and looks exactly like one taken ten seconds ago. Check “Scan timestamp:” before you act, and re-scan after any change.
9.2.10 The snapshot rule #
Write this on the inside of your eyelids. Everything in 9.2 is a snapshot.
Channel health is from the moment of the scan. “Scan timestamp:” is the only proof of when.
The network map is from the moment of the map. “updated” in the header is the only proof of when, and its advice treats anything over 30 minutes as worth refreshing.
Neither reacts to what is happening while you look at it, and neither clears itself when it goes stale.
After any change, whether you moved a channel, moved a router or re-paired a shade, run the scan or the map again and then drive the shades.
9.3 OTA Firmware (Zigbee devices) #
This tool updates the firmware inside motors, plugs and remotes over the air. It does not update the coordinator, which has its own firmware and its own update page (see 6.1), and it does not update the bridge (Settings → System Update).
Select exactly one Zigbee device in the Discovery table, then: Check OTA update (queries for available firmware), Start OTA update, or Schedule OTA update for later (with unschedule). A progress bar tracks the transfer. The bridge’s own confirmation sets the expectation: “This can take 10-20+ minutes and should be done one device at a time.” Optional fields allow a custom firmware URL, downgrade mode, and force mode — SI support tools; leave them empty in normal use.
9.4 Groups (Zigbee) #
Create, rename, and delete Zigbee groups per coordinator (a group ID can be set manually but is normally automatic). Member add/remove is done through the guided workflow on the main Groups page (section 5.5). Zigbee group commands are broadcast once on the mesh, so members move in perfect sync — always prefer a group over multi-selecting shades when simultaneous motion matters.
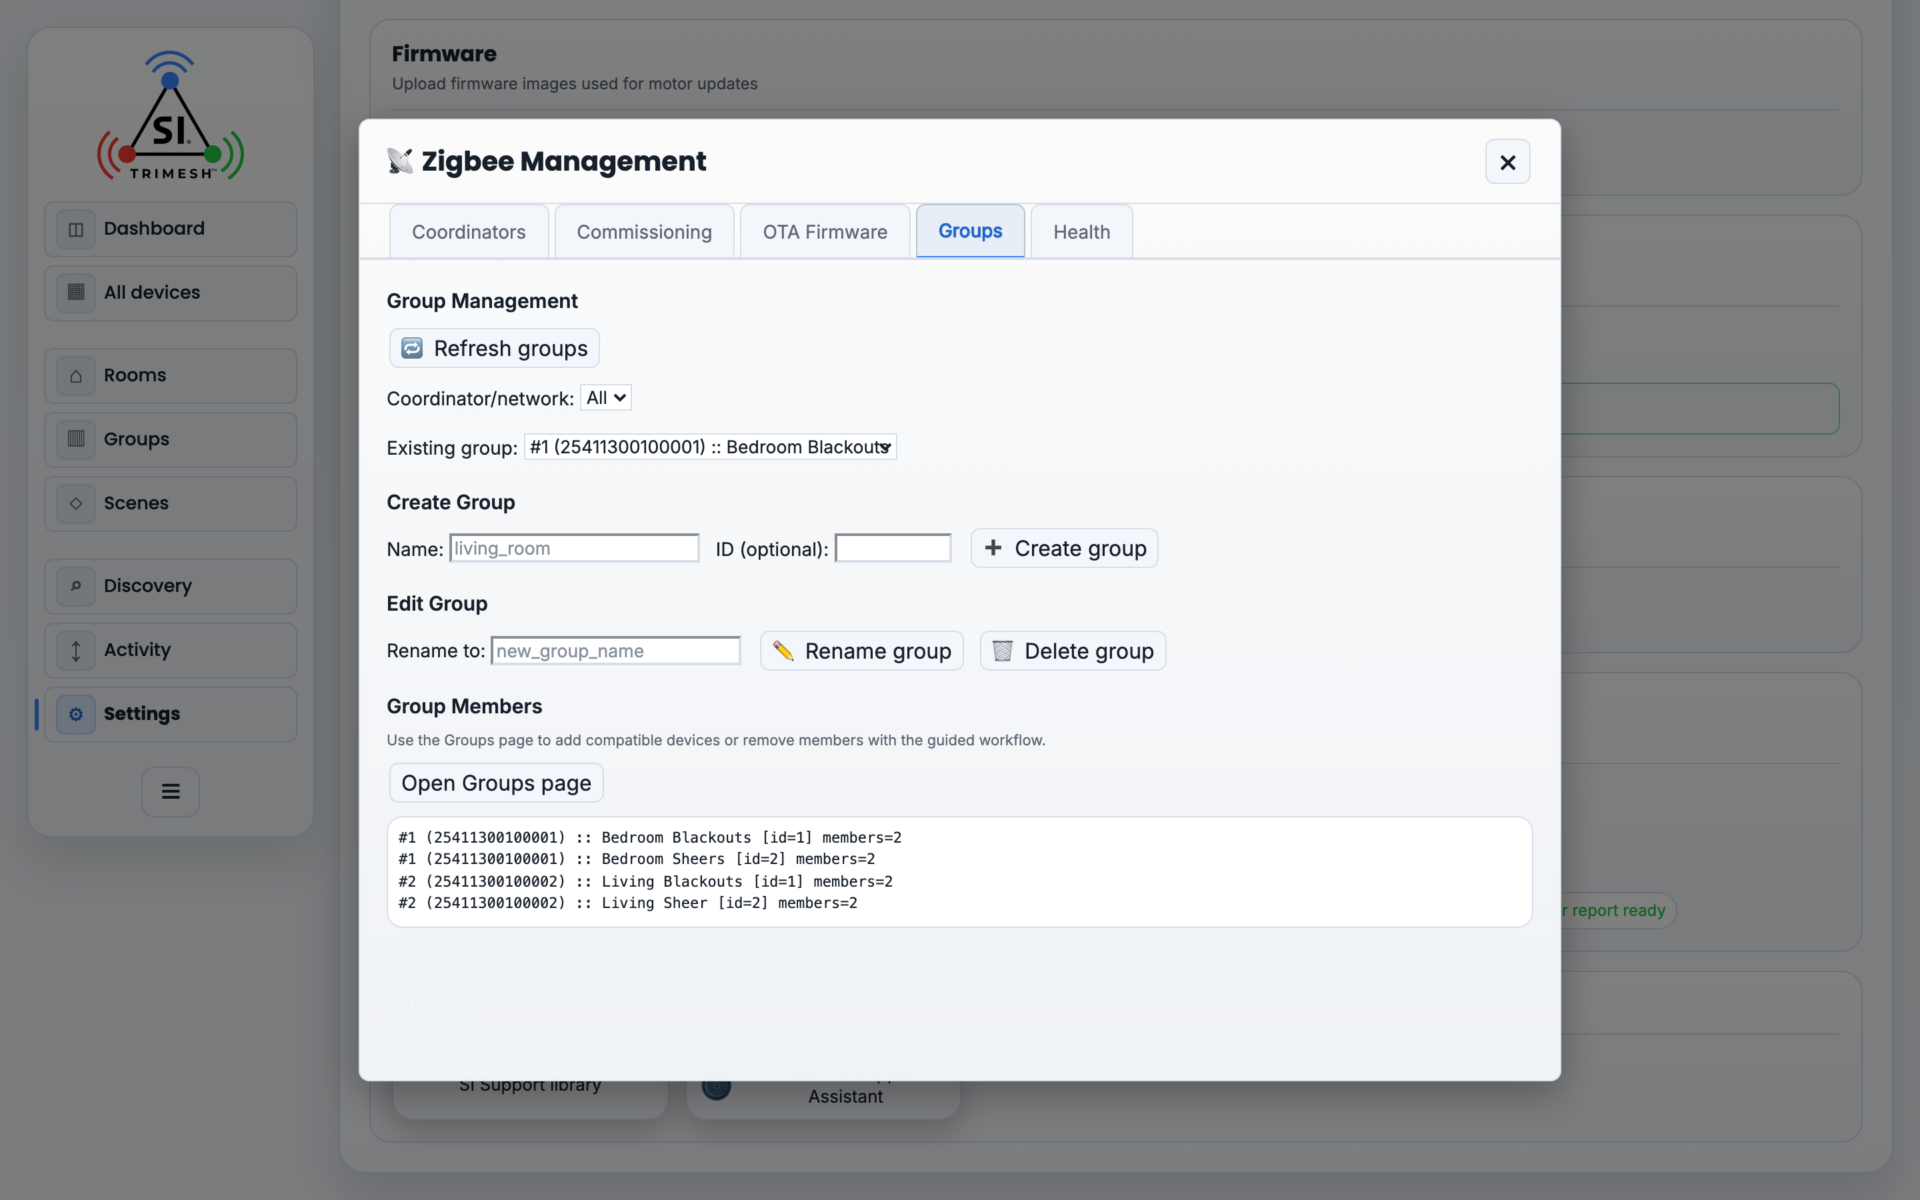
The Zigbee Groups tab, where groups are created, renamed and deleted.
9.5 Network Backup and Migration #
Coordinators tab → Network backup and migration. Export backup downloads a zip archive of a slot’s entire Zigbee network — including the network encryption key, so store backup files securely. To restore (e.g., onto a replacement coordinator): power off the original coordinator, choose the backup zip, Validate backup (shows what is inside; the staged restore expires after 10 minutes), confirm the original coordinator is powered off, then Restore network to selected slot.
After a restore, power-cycle the Zigbee routers (mains-powered devices) and allow 5–10 minutes for the mesh to reassemble. The previous data is kept for automatic rollback until the restored network passes its health check.
9.6 The Network Map and its routing recommendations #
Directly below channel health, under a dividing line, is “Network map:”. Where the scan asks is the band busy, the map asks how is the mesh built and who relays for whom. It does not touch channels.
The row carries an “Include routes” tick box (off by default), a “Refresh graph” button, an “Open graph” button that stays greyed out until a map has been fetched, and the fixed note “Large networks can take up to 3 minutes to generate.”
Tick “Include routes” before you press “Refresh graph”. The advice list asks for it in as many words, and the map’s own “Route counts” overlay stays unavailable without it.
While it works, the button’s label is replaced by “Generating… (up to 3 min)”. Unlike the scan button, this one releases itself as soon as the map is ready, so it is progress you can trust. Underneath, the output box goes from “(No network map requested yet)” to a summary: “Updated:”, “Nodes: 24 (1 coordinator, 6 router, 17 end devices)”, “Links:”, “Route entries:”, “Routes requested: yes”, and “Open graph for the interactive view.” If the response was not usable it says so: “A network-map response was received, but it is not usable raw graph data.” Pressing “Open graph” with nothing fetched puts up No raw network map is cached yet for this coordinator. Click “Refresh graph” first.
The graph window. Titled “Zigbee Network Map”. Under the title is one line worth reading before anything else: the coordinator, its serial, “updated” and the time, and whether routes were “included”, “partially read” or “not requested”. If it says routes were not requested, go back and refresh with the box ticked.
The toolbar carries a search box (“Name, IEEE, model, manuf…”), four “Links” tick boxes (“Parent”, “Child”, “Sibling”, “Other”, all on), four “Labels” options (“Friendly” on, plus “NWK”, “Model”, “IEEE”), and an “Overlay” group holding “Device images”, “Route counts” and an “LQI” choice of three:
LQI setting | What it does |
|---|---|
“Hide” | Hides the numbers and draws one line per device pair. Best for reading names on a crowded map. |
“Merged” (default) | One line per device pair, labelled with both ends’ numbers, for example “78 / 64”. This is the mode to read a house in, because a lopsided link shows at a glance. |
“All” | Every reported direction as its own line with its own number. Use it when you need to know which end reported which figure. |
“Center graph” at the top right refits the drawing. Leave all four “Links” boxes ticked: unticking any one makes the advice list hold everything else back and tell you to restore them.
Node colours and sizes are in the “Legend” card: coordinator red and largest, router blue, end device green. The “Overview” card counts what is drawn, so the “Links” number moves when you change the LQI setting or the link filters. It is not a health score. The one useful check there: does “Routers” match the number of mains-powered Zigbee devices you actually installed?
Three gestures that are not obvious. They are printed in the Selection card, and they are the whole value of the map:
Click a device to see its details.
Click the same device again to focus it. Everything else fades and only its own links stay bright.
Click one device, then hold Shift and click another. You get “Estimated path” between them, plus “Routing recommendations”. Without that Shift-click there are no recommendations at all.
Double-click or scroll to zoom. Drag a node to settle the layout, drag the background to pan.
The Selection card shows “Type”, “IEEE”, “NWK”, “Model”, “Manufacturer”, “Neighbors”, “Failed checks”, “Last seen” and “Description”. “Failed checks” is the row to watch: anything other than “none” means the bridge could not read that device on this pass, so every figure about it is provisional.
Below that, “Neighbor reports” lists what other devices say about this one, one collapsible block per reporter, headed “Reported by …”. The screen carries its own caution: “Attributes of this node as reported by other devices. Reports can differ or be stale. Tree depth is not routing distance.” One row earns its keep: “Receiver when idle” should read “On” for a mains-powered relay. A device you installed as a repeater that reports “Off” is being seen as a sleeping end device and is not relaying, which is worth chasing. “Permit joining: Accepting joins” left on after commissioning is worth closing. Ignore “Tree depth”; the screen itself says it is not routing distance.
Re-reading one device instead of the whole house. In Advanced view the Selection card also carries “Network tables” with “Read neighbor table”, plus “Read routing table” on routers and the coordinator. The button reads “Reading neighbor table…” while it works and then reports, for example, “14 entries · 6:57:04 PM”. It gives up after 65 seconds with “Table read timed out; wake the device and try again.” On battery devices it adds the note “Wake a sleepy device before reading. Some end devices do not support neighbor-table reads.” A successful read is merged into the map on the spot, and the header line then also says “node table updated” with the time. This saves sitting through another whole-house map when only one or two devices failed.
“Estimated path” lists the devices in order and, in the “Basis” row, how it worked them out:
“Basis” | How much weight to give it |
|---|---|
“Active route tables” | The bridge found this route written in the devices’ own tables. The strongest evidence available. |
“Route tables to parent” | Followed real routes as far as the destination’s parent, then its reported child link. It does not establish a route to the end device itself. |
“Cost estimate” | Worked out from link quality, using the worse of the two reported directions. An estimate. |
“Incomplete topology” | Fewest-hop guess, because link quality was missing or incomplete. Weakest. |
“Unavailable” | No path could be traced. The heading reads “No path found”. |
Whatever the basis, the panel always ends with the same caution: “This is not observed traffic. Source routes, route age, cost hysteresis and other stacks can change the actual path.”
“Routing recommendations” appears under the path. Read its summary line first; there are exactly three:
Summary line | What it is telling you |
|---|---|
“No clear routing changes suggested by this snapshot.” | Nothing on this path met its screening criteria. That is silence, not a certificate of health. |
“Collect a complete, current view before choosing routing changes.” | The tool is declining to judge. The items listed tell you what to go and collect. |
“Suggested checks for this path; confirm them before changing the installation.” | It has something to say about the links. This one gets an orange bar. |
Two figures sit under the summary: “Lowest reported LQI” and “Router hops without a reciprocal bypass”, that second one being how many hops on this path have no measured alternative route around them.
The items themselves come in two groups. The first six are data-quality items, and if any one of them fires the tool holds back all the link-quality items.
Item title | When it appears | What to do |
|---|---|---|
“Restore all link types” | One of the four “Links” boxes is unticked. | Tick “Parent”, “Child”, “Sibling” and “Other” back on. The most common reason for a near-empty list. |
“Refresh the map before making changes” | The map is older than 30 minutes, its time looks wrong, or a device failed to read. | Refresh with “Include routes” ticked. For one or two failed devices use “Read neighbor table” instead of a full re-map. |
“Confirm connectivity first” | No path could be traced between the two devices. | Restore all link types, refresh with routes, check that the routers in between have power, and wake a battery device. Its own closing line: an absent path alone does not prove a coverage gap. |
“Collect missing link-quality readings” | Some hops on the path have no usable LQI. | Refresh and test command delivery. A blank LQI is a missing measurement, not a bad link. |
“Collect both directions of router links” | A router hop has a number from only one end. | Re-scan. A one-sided report does not prove a one-way link, and is not grounds for moving hardware. |
“Confirm the path evidence first” | The path itself is uncertain, for example a device reports more than one parent. | Fresh scan with routes, confirm which router the device is parented to, and confirm commands get through. |
The next three appear only when all six above came up clean:
Item title | When it appears | What to do |
|---|---|---|
“Recheck a router cost near a boundary” | A router-to-router link sits right on a threshold, so its cost could read either value next time. | Nothing structural. Confirm delivery and compare a later scan. Up to three of these are listed. |
“Recheck a higher-cost router hop” / “Investigate a low-quality end-device link” / “Recheck an end-device link” | The worst three hops that met the screening criteria, lowest LQI first. | Follow the order in the item, quoted below. |
“Verify a candidate with lower estimated cost” | The mesh is using a recorded route that looks costlier than one that exists. | Compare command delivery only. Its own words: a lower-cost estimate alone is not a reason to force route repair or add hardware. |
The weak-link item is the one that names rooms and gives you a work order. Its action always opens with the same two sentences, and the order matters:
Repeat the scan and test command delivery in both directions. Check for metal obstructions and nearby 2.4 GHz interference sources.
Only when a hop is in the severe band and the map holds no measured alternative around it does it add hardware advice, and even then it puts repositioning first:
Where the installation allows, try repositioning an existing powered router first. If this link stays weak or commands fail, test an additional always-on Zigbee router between device A and device B, within radio range of both.
On an end-device link it adds one more line that saves callbacks:
An added router does not force an end device to change parent; follow the device’s reparenting guidance and verify its new parent.
If a measured alternative route does exist, the advice changes to verifying that first: “Verify the existing alternative with fresh route tables before adding hardware; Zigbee chooses its own routes.”
Where the numbers come from. Router links are graded on an estimated cost ladder, and the bands are worth knowing because they are the only place the tool attaches a verdict to a number:
Reported LQI | Estimated cost per hop |
|---|---|
80 and above | 1 |
64 to 79 | 3 |
48 to 63 | 5 |
below 48 | 7 |
Where a link sits on a boundary the tool prints a range instead of a single figure, because the previous value affects the current one: LQI 43 to 52 shows 5 to 7, 59 to 68 shows 3 to 5, and 75 to 84 shows 1 to 3. A hop between two routers is costed at the worse of its two directions. Router hops are only called out when the cost is definitely above 1.
Shade-to-router links are screened differently, and the screen states it plainly: LQI below 60 is low, and 60 to 99 is worth checking.
The tool publishes its own limits in the collapsible “Router counts and assessment basis” block, and they are blunt enough to be worth reading aloud to anyone about to sell a repeater:
Router links use estimated Ember costs 1/3/5/7 from reciprocal LQI reports. Cost 1 does not prove reliable delivery; other stacks may use different calibration. Cost ranges account for unknown Ember hysteresis state.
End-device links use separate screening hints: LQI below 60 is low; 60–99 is worth checking. These are not radio-independent reliability limits. A single parent report is normal for an end device.
Router neighbors include coordinators; siblings are a subset. Child counts are observed attachments, not traffic load or remaining capacity. Capacity needs the device model and firmware limits.
The scan completion time is not every link’s measurement time. The 30-minute review window is a display policy, not Ember neighbor or route expiry.
The graph is not a floor plan. Placement suggestions are trials based on device names and assigned rooms; verify them with fresh scans and command delivery.
And it closes with: “A bypass candidate requires usable reports in both directions through routers in the full snapshot. It is not a proven backup route. Hop count alone does not trigger advice to add hardware.”
That 30-minute window applies to the map’s advice only. Channel health carries no staleness warning of its own, which is why 9.2.10 puts the weight on “Scan timestamp:”.
Testing a fix without leaving the map. Selecting a shade in the map gives you a “Commands” block with up, “50%”, down and “Stop”, and its position and battery where reported. Every recommendation in the list ends with “test command delivery”, and this is where you do it.

The map summary on the coordinator page. “Routes requested: yes” is the line to check before trusting the advice.
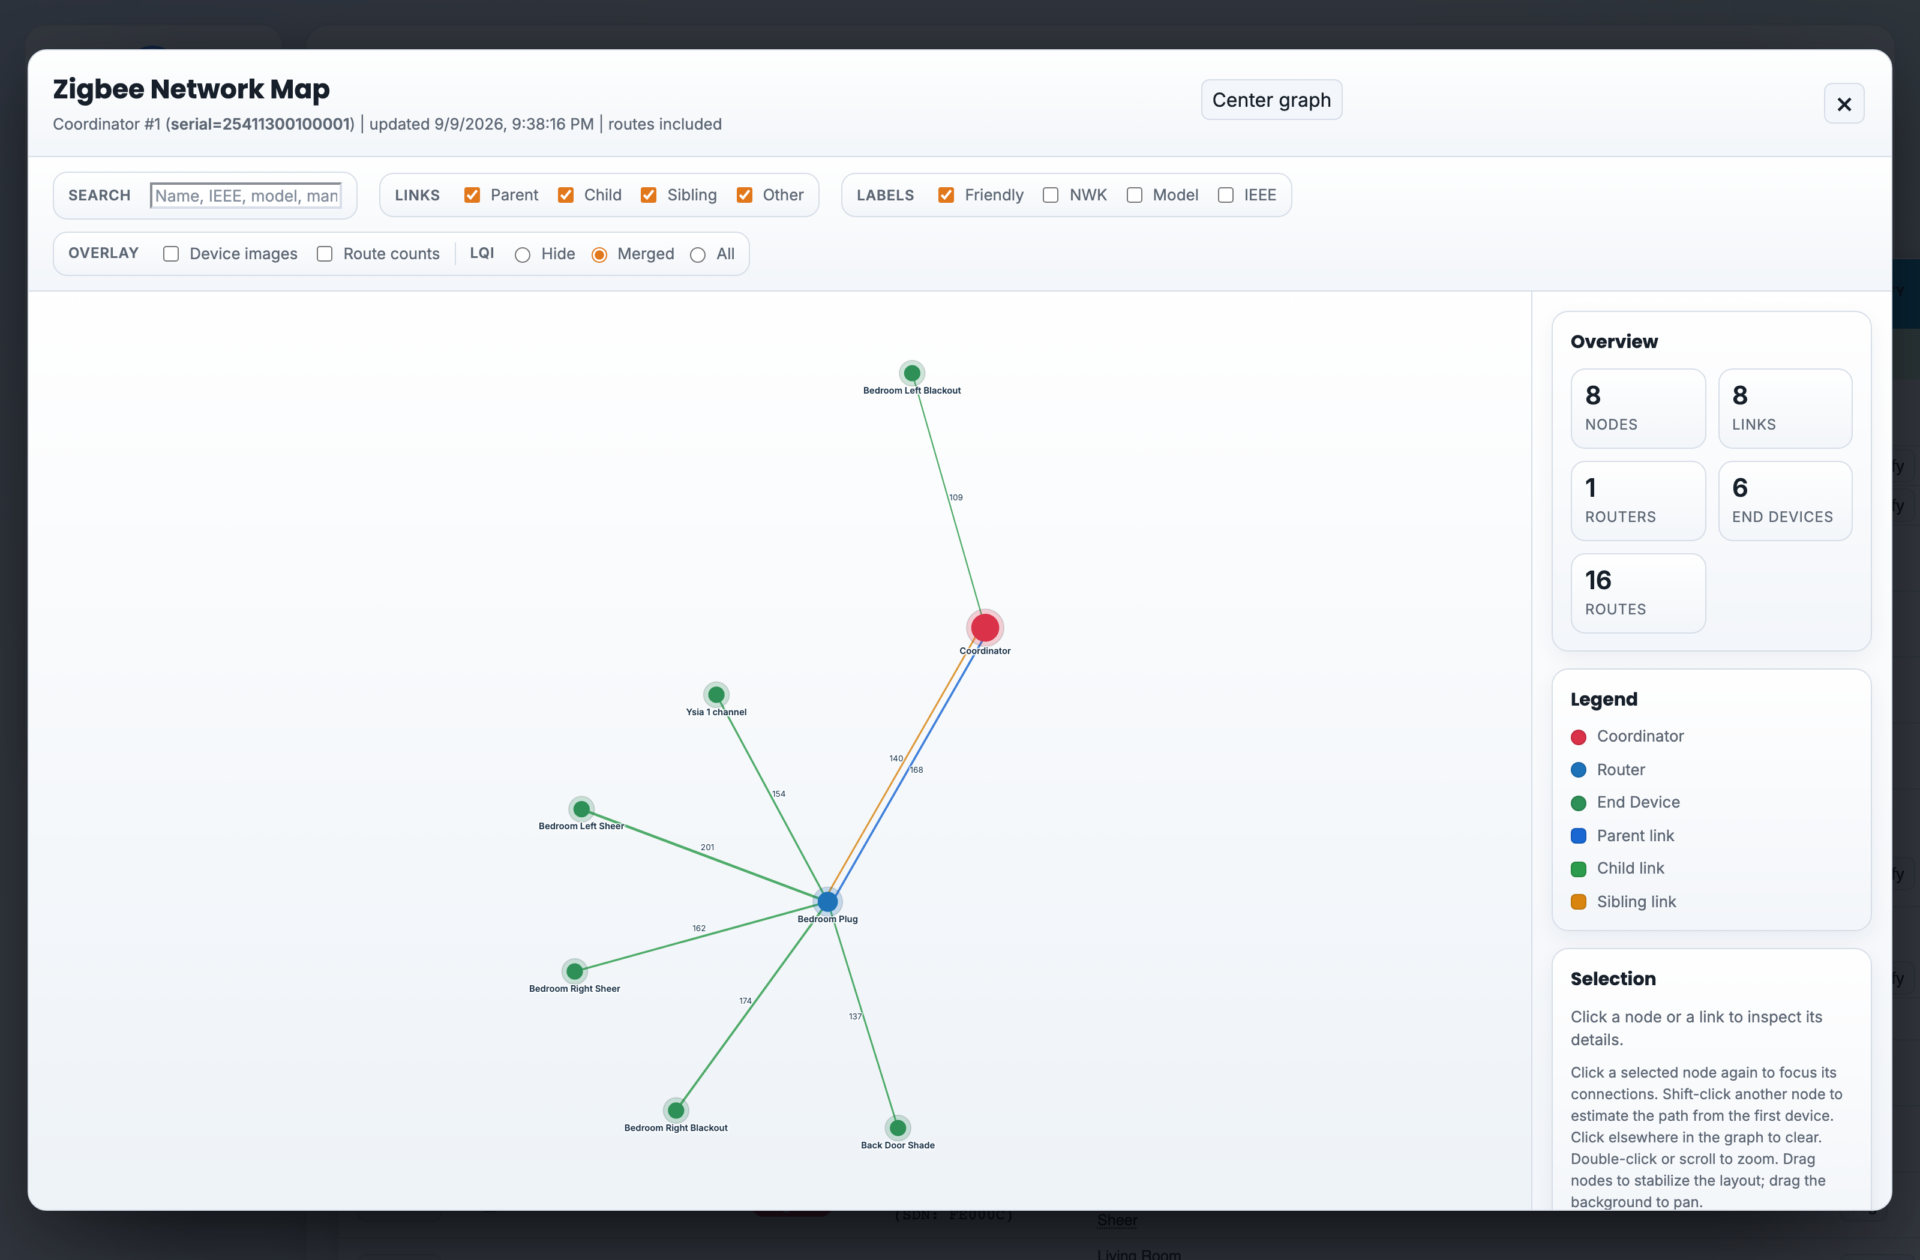
The interactive map of one coordinator’s network — coordinator, one router, and the battery shades hanging off it.
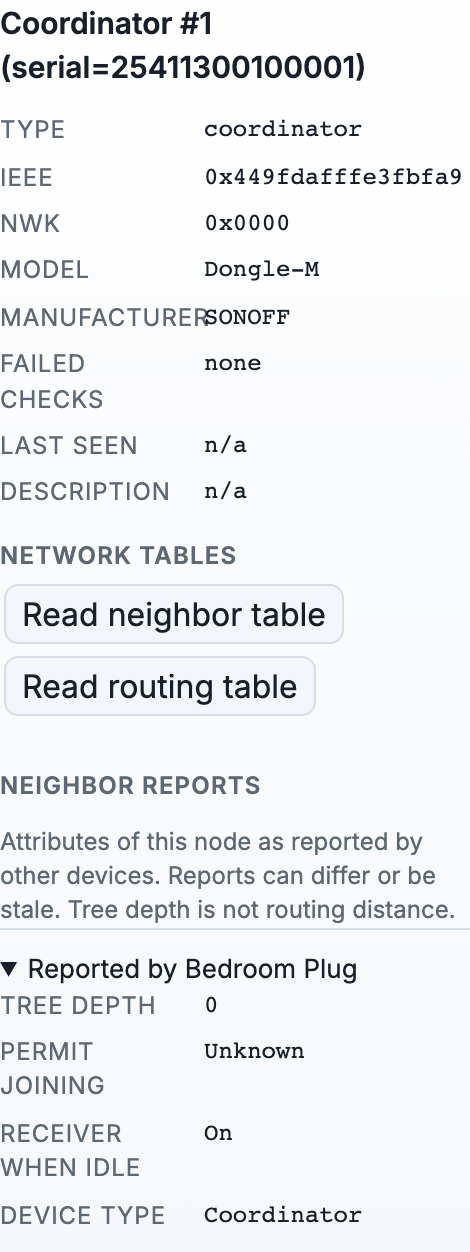
The Selection card for one device.
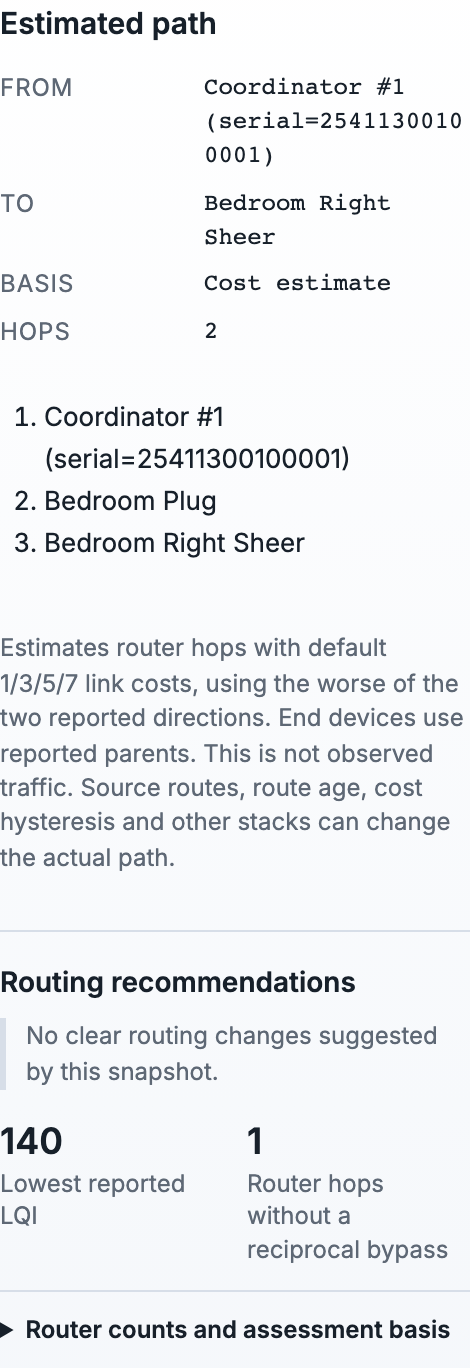
An Estimated path from Shift-clicking, with the Routing recommendations underneath. Here the coordinator reaches a bedroom shade in two hops through a Smart Plug, and the advice reads “No clear routing changes suggested by this snapshot.”
9.7 Address Repair #
A recovery tool for a Zigbee device that is paired but has stopped responding: enter its IEEE address (from Properties) and the bridge re-resolves its network address, optionally re-interviewing and re-configuring it. Options cover sleepy (battery) devices. Try this before removing and re-pairing a misbehaving device.
10. Scenes and Automation #
Covered as part of the interface tour — see section 5.6 for scene building and triggers, and section 5.9 (Time & Location) for the one-time setup that enables schedules and sunrise/sunset automation.
Design guidance for installers:
Build groups for anything that must move in unison; then build scenes that command those groups. Scenes that command many individual devices fire commands one after another; scenes that command a group fire once.
Keep homeowner-facing scenes on the Dashboard as widgets, with favorites for individual shades they adjust often.
Remember scenes live on the bridge: they keep firing on schedule even if the home’s control processor or internet is down.
11. Integrations: Control Systems and the Local API #
There are two ways off the bridge. A TRO.Y carries the bridge’s shades to a control system such as Control4, Crestron, Savant, RTI or Bond, and is also where wired and RTS motors live — that is section 11.1. A local WebSocket API serves smart-home platforms such as Home Assistant directly — sections 11.2 and 11.3.
11.1 Combined Systems: TriMesh + TRO.Y #
When a job needs a TRO.Y. Any of these puts one in the rack: wired 485 motors, RTS shades or RTS handheld remotes, Lutron, or a control system (Control4, Crestron, Savant, RTI, Bond). With none of those, the bridge is the whole job.
How the two divide the work. The bridge keeps running its own shades; the TRO.Y imports them so a control system can reach them.
Lives on the bridge | Lives on the TRO.Y |
|---|---|
Zigbee shades (Low Voltage, WireFree) | Wired 485 motors |
PoE shades | RTS shades (through a Pegasus) and RTS handhelds |
Smart Plugs, Smart Outlets, Zigbee remotes | Lutron |
Zigbee groups | Wired 485 groups and RTS groups |
Every scene and schedule | Control-system integration |
Home Assistant (native) |
On the TRO.Y the bridge’s shades appear as rows badged “(IP Bridge’d)”. On the bridge’s Groups page, TRO.Y-made groups appear under TRO.Y-handled groups for viewing and control only; a group spanning both systems shows as one card titled [TROY] <name>, badged with each protocol it covers.
Do not plug a Helen coordinator into the TRO.Y’s Helen Port, and do not pair Zigbee shades on the TRO.Y. On a combined job the bridge’s coordinator owns every wireless shade, and two coordinators claiming the same shades is the classic failure. Extra Helens as routers belong to TRO.Y-only systems.
The order of work: finish the bridge completely, connect the two, then the TRO.Y, then hand off.
Connecting them #
One Ethernet patch cable from the bridge’s RS485 port to any of the four BUS ports on the TRO.Y. It uses a network connector but it is not a network link — it is the wired bus between the two boxes, so it runs port to port and does not pass through the switch. Both boxes still need their own network connections.
Every Zigbee motor is given a TRO.Y-facing address (FE00xx) automatically; it appears under the motor’s Device ID on the Discovery page as (SDN: FE0005). Plugs, outlets, remotes and coordinators get no address and never cross over.
Four signs the link is working:
The TRO.Y’s table shows the bridge’s shades as
FE####rows badged “(IP Bridge’d)”.The bridge’s Install Report lists one extra device on the SDN protocol with the id
000001— the link itself. It does not appear on the Discovery page.The Install Report’s Troy Exposed count reads the motor count plus one, the extra being that link row. (With no TRO.Y attached the same tile equals the motor count exactly.) A DUO shade counts as two motors. A count lower than the motor count means that many shades never got an address.
The installer status check Troy-facing SDN IDs unique is green.
“Online” on the bridge’s SDN row alone proves nothing — use the four signs.
If the shades do not appear, in order: check both ends of the cable; swap the data pair, since a crossed pair looks identical to a dead port, then try the other Bus Out; press Re-launch IP discovery on the bridge’s Discovery page, which re-scans the wired connection despite its name; then clear the TRO.Y’s integration table and run its 485 discovery again.
The TRO.Y side #
The existing TRO.Y articles in the SI support library cover each screen. What follows is the order for a combined job and the traps that matter.
Find the right one. A building can hold two, both factory-named SI_TRO.Y. Confirm the address and firmware on its status page before changing anything. It talks to one client at a time — two browsers open on it corrupt each other’s replies.
Network settings first, then restart. Settings save without a restart, but the restart is what makes them take effect. The same applies to Telnet/JSON integration settings and to any username or password. Nothing else needs one.
Firmware. Take a full site backup first (Integration Report & Backup → Create Report/Site Backup), use a wired connection, then enable bypass mode — the page asks for a momentary press of the TRO.Y’s reset button. Upload the file and never interrupt it; an interrupted upload can damage the unit with no on-site recovery. It applies on restart, and the proof is the compiled date on the hub page rather than a filename. The current released version is 3.33. Firmware files are on the Firmwares: TRO.Y & Helen page in the support library.
Import the bridge’s shades. Run the TRO.Y’s 485 discovery even if the job has no wired motors — that is how the bridge’s shades arrive. Name them and press Commit Integration Table.
Add the wired 485 shades. 485 wiring is a star, not a daisy chain: each motor home-runs to a Janus, which carries power and bus for up to eight shades. Three things about the scan: discovery never says “done”, so scan again if something is missing; a DecoFlex keypad can be discovered as “Moab”, the same device under a different type label, which must be fixed before Commit; and the Pegasus appears in this scan too.
Commit is not optional. A row that is not committed is invisible to everything — the app, the control system, the bridge. Commit wipes the whole table and rewrites it, so after adding or renaming anything, press Commit and do not refresh, navigate away or unplug until it finishes. Two cautions: labels truncate to 16 characters, so keep the first 16 unique; and the green “Table is Committed” box is the browser’s own flag, not the TRO.Y’s state, so reload and check the names are showing.
Wired limits, straight after the scan, while you are still at the shades. On the TRO.Y’s own page: press Adjust Upper or Adjust Lower first, which unlocks the out-of-limit move buttons XFAST / XJOG / XFINE; move only with those, since the ordinary buttons stay inside the old limits; wait until the shade has fully stopped; then press Set. The two reasons a save “did not take” are moving with the wrong buttons, or saving before the shade stopped. Every safety rule in section 7.4 applies unchanged.
The Pegasus and RTS. The Pegasus unit is the row whose device function is Pegasus; the rows listed under that endpoint are the RTS motors it drives. Do not confuse them. In strict order: the Pegasus on the bus and found by the scan, then named and committed, then each RTS shade taught to it, then the remotes. One RF mode per Pegasus — mixed remote types need a second one. RTS limits are set with the RTS commissioning remote at the motor, never from a hub, and RTS handhelds are taught to the Pegasus, never to the bridge.
Groups. Wired 485 groups are built on the TRO.Y and written into each motor’s eight group slots. Zigbee groups stay on the bridge; the two are never mixed. RTS groups must be built in this order or the group is not there to pick: create the 485 group as an address-table entry, Commit, and only then pair each RTS motor into it from the Pegasus screen. Pairing is a toggle — pairing a motor “again, to be safe” removes it.
Bond imports additions and never removes — delete retired shades in Bond by hand.
What goes where on a combined system #
Question | Answer |
|---|---|
Scenes and schedules? | The bridge, always. A bridge scene has no step limit; a TRO.Y scene has exactly seven. |
Groups? | Zigbee on the bridge. Wired 485 and RTS on the TRO.Y. |
Limits? | Zigbee and PoE on the bridge. Wired 485 on the TRO.Y. RTS with the commissioning remote at the motor. |
A remote button for a TRO.Y shade, a PoE shade, or a scene? | A Device trigger in the bridge’s Scenes — there is nothing to bind. Single-channel remotes only: a multi-channel remote is greyed out in the trigger list, which is intended on this release. |
A remote button for one Zigbee shade or group? | A binding on the bridge (section 6.2). |
RTS handhelds? | Taught to the Pegasus, never the bridge. |
Zigbee channel planning? | From the bridge’s channel scan; the TRO.Y has none. |
Replacing a bridge shade? | The TRO.Y row keeps the old |
Backups? | Both. The TRO.Y site file and the bridge’s site file and coordinator backup. |
Handing over a combined job #
Everything in section 12.6 applies, plus: save the TRO.Y site file, and export the bridge’s coordinator backup and site file as well — the TRO.Y site file contains no Zigbee, so without the bridge’s backups a coordinator replacement means re-pairing the house. Do not use Backup / Restore Helen Zigbee Trust Center Credentials on the TRO.Y; the bridge’s own coordinator backup is the one that matters. Never paste a Helen Diagnostics dump into open email — it carries the Zigbee network keys in clear text with no login. All of these files hold network keys: job record only, never email, never a ticket attachment.
11.2 API Tokens #
The bridge offers a local WebSocket API for smart-home platforms such as Home Assistant. It is designed for status, monitoring, and control; commissioning always stays in the web interface. Full developer documentation, including a live message tester, is built into the bridge at Settings → Local API Docs.

The built-in API documentation, served by the bridge itself.
Integrations authenticate with named bearer tokens, managed at Settings → Local API Tokens:
Enter a name describing the integration (e.g., “Home Assistant”) and press Create token.
The token secret is displayed exactly once. Copy it into the integration before closing the panel — there is no way to view it again, only to revoke and re-create.
The token list shows each token’s name, creation date, and last-used time. Revoke tokens that are no longer used.
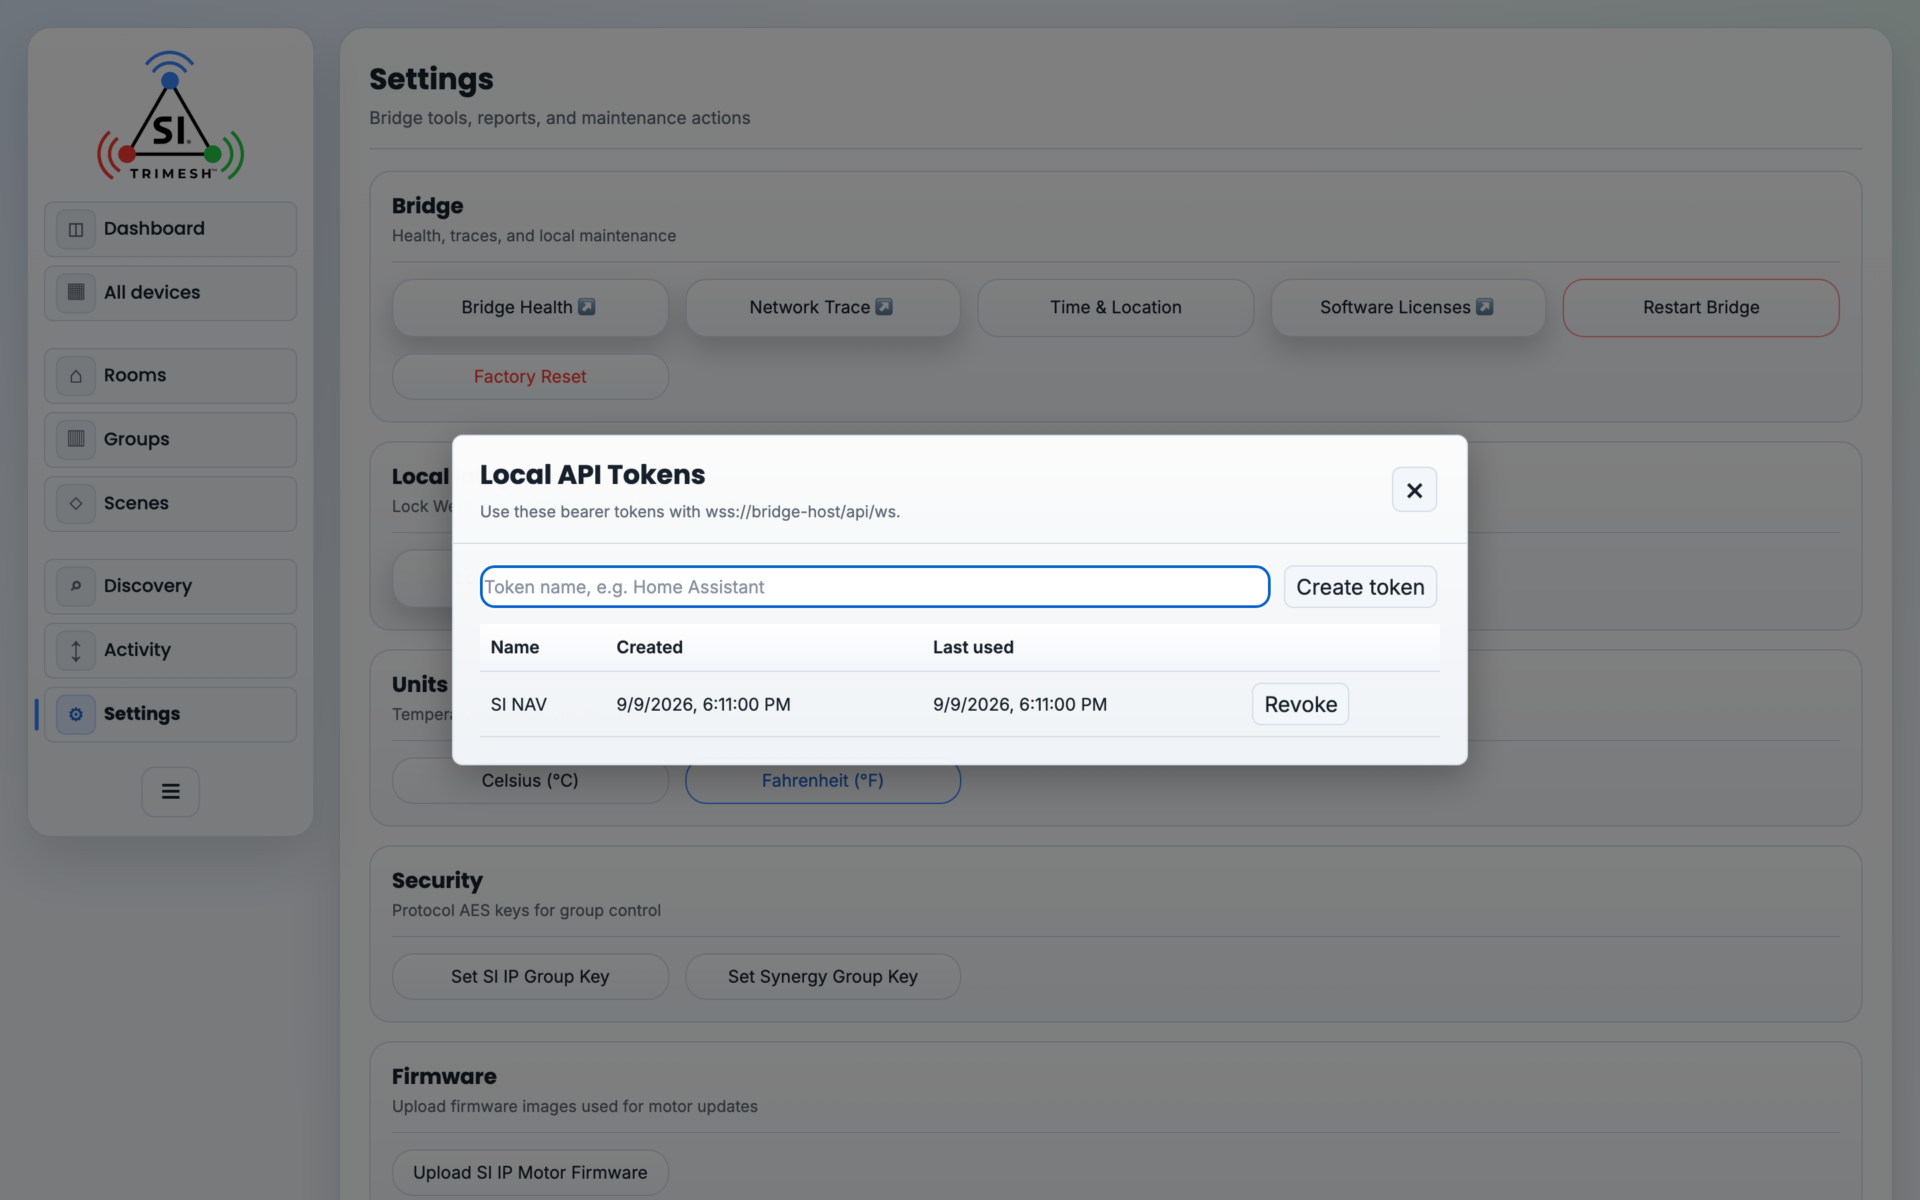
The API token list, showing each token’s name and when it was last used.
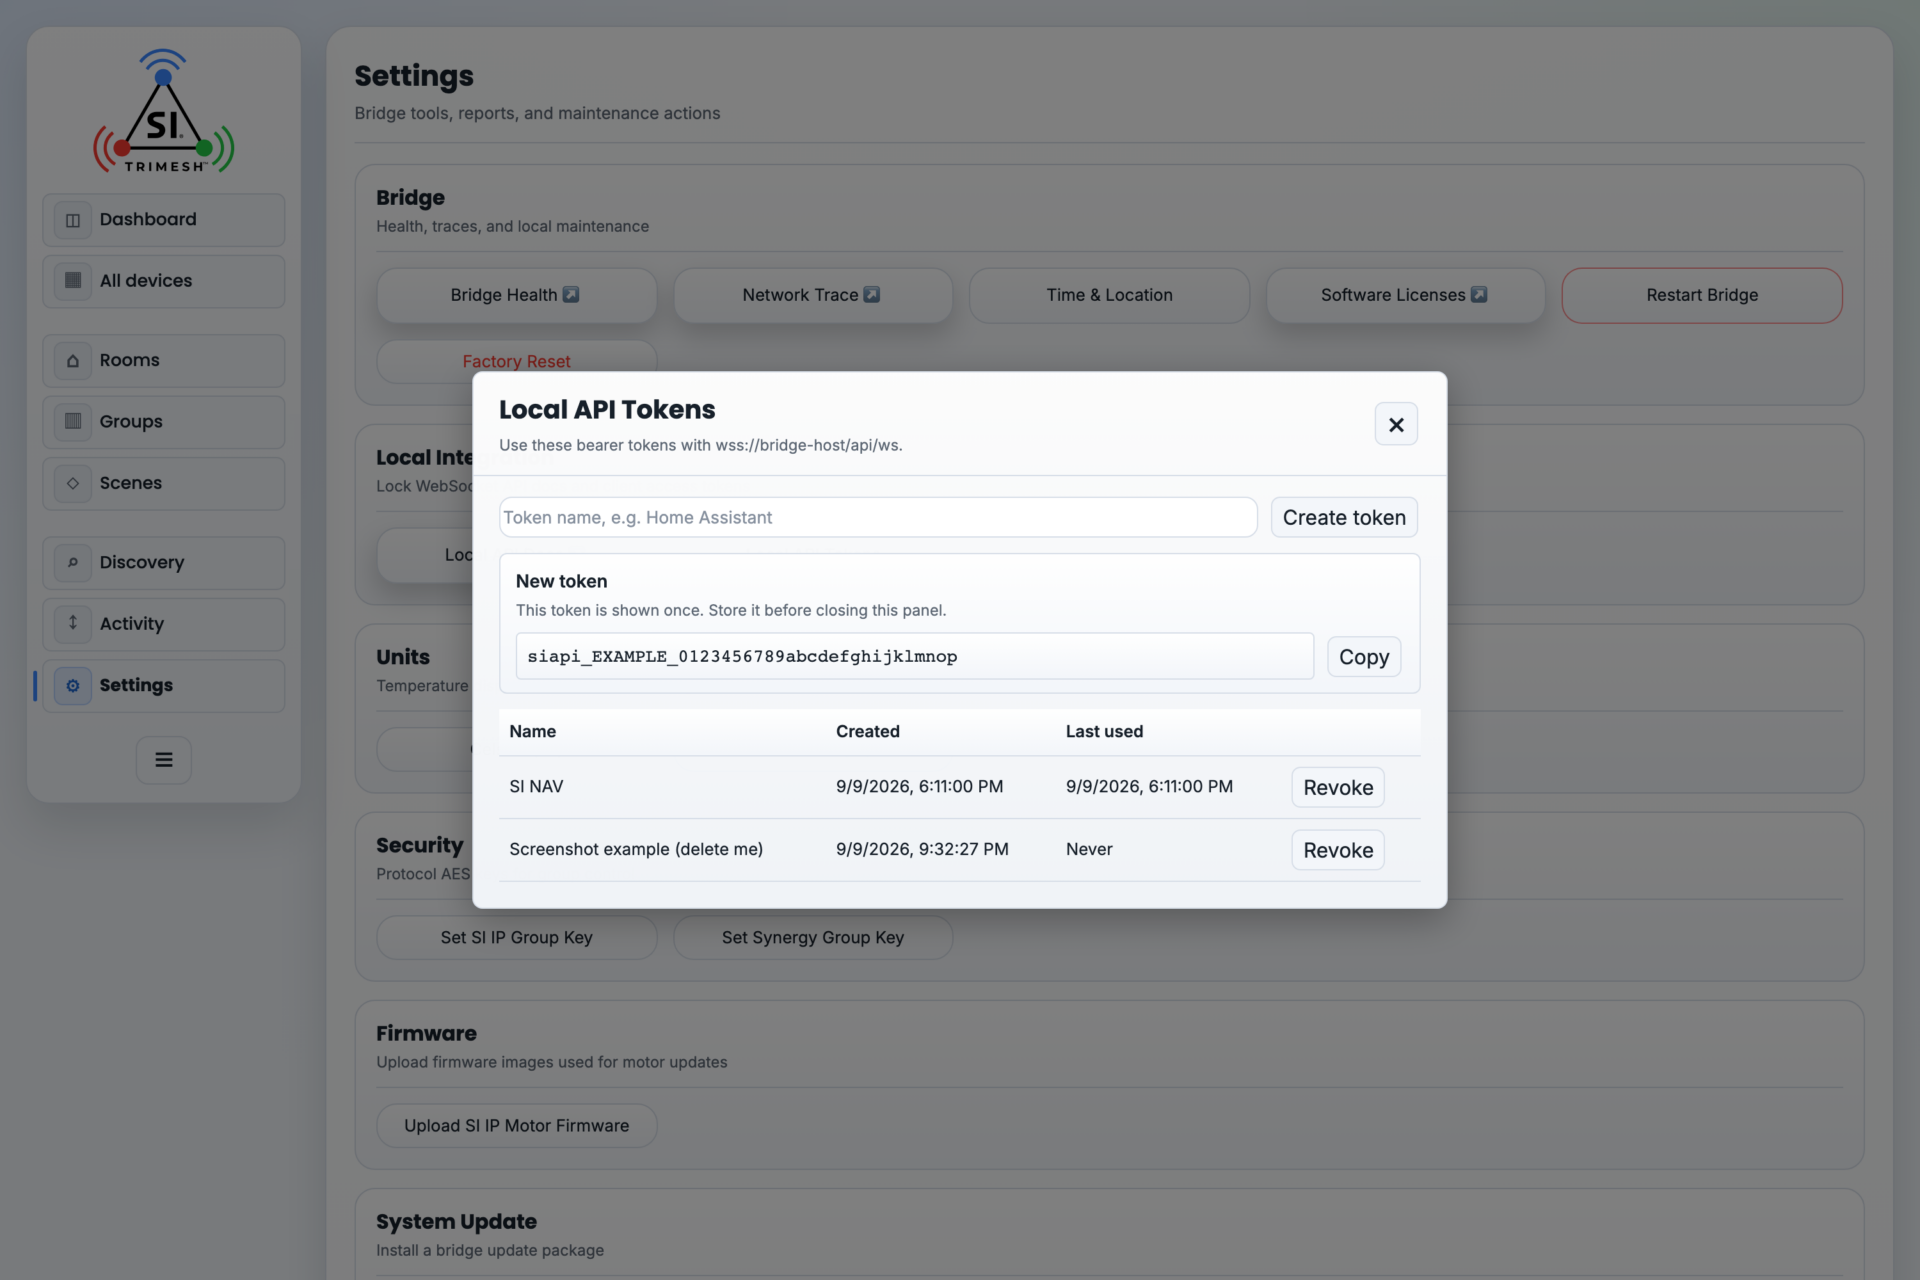
The New token panel. The secret is shown once and once only — copy it before closing. (The value here is masked; the token itself was revoked immediately after the capture.)
11.3 API Summary (for integrators) #
Endpoint:
wss://<bridge-host>/api/ws, JSON messages. Native clients sendAuthorization: Bearer siapi_<id>_<secret>; browser clients pass the token as a WebSocket subprotocol (["siapi", token]).On connect, the bridge sends
helloandinitialDevices(every device, keyed by a stable UID such aszigbee-0xabcorsdn-5). Live changes arrive asdeviceUpdated/devicePropertiesUpdated/deviceRemoveddeltas.One normalized device model covers all protocols:
display(name, room, model),capabilities(which controls exist — gate your UI on these),properties(state values such asmotor.position,switch.state,light.brightness,sensor.temperature,diags.battery).Commands:
deviceCommand(one device),groupCommand(a native group),broadcastCommand(protocol broadcast). Motor commands:motor.move,motor.moveSavedPosition,motor.setSavedPosition,motor.setAutospacedSavedPositions; pluslight.*,switch.*,property.get/property.set,identify,rename,refresh. There is no separate stop command — a stop ismotor.movewith a stop direction rather than a position, so integrators do have a stop; it is just not its own verb.Saved positions in groups: supported for SI IP, Synergy and SDN groups. Zigbee has no native saved-position group commands — address Zigbee shades individually for those.
Multi-endpoint Zigbee devices (a multi-channel remote, for example) appear as separate normalized devices: the lowest numbered endpoint keeps the physical UID and the others carry a suffix.
motor.reversedis a readable and writable property on SI IP and Synergy motors (true means reversed).Command parameters go under
args, and a move is a direction (up,down,stop) or apositionpercentage — not both. Sending parameters under any other key returns a rejection that reads like a missing-parameter error.commandResultacknowledges acceptance and echoes theidyou sent, which is the only way to match an answer to its command; confirm actual state from the follow-up device updates.Native pass-through: commands prefixed
zigbee.*,siip.*orsdn.*reach a protocol back end directly. These are SI service tools — a normal integration never needs them.Bridge-level:
bridgeCommandwithrestart.A client may also request
getDevicesat any time to re-read the whole device list, for example after its own restart.
12. Maintenance and Troubleshooting #
12.1 Bridge Health Page (Advanced view) #
Settings → Bridge Health is the live vital-signs page: device and warning counts, bridge and system uptime, hostname, IP and MAC addresses, router/gateway details, processor load, memory, storage, and per-protocol status (online/offline and device count for SI IP, Synergy, SDN, Zigbee). Check it first on any “the system is acting strange” call.
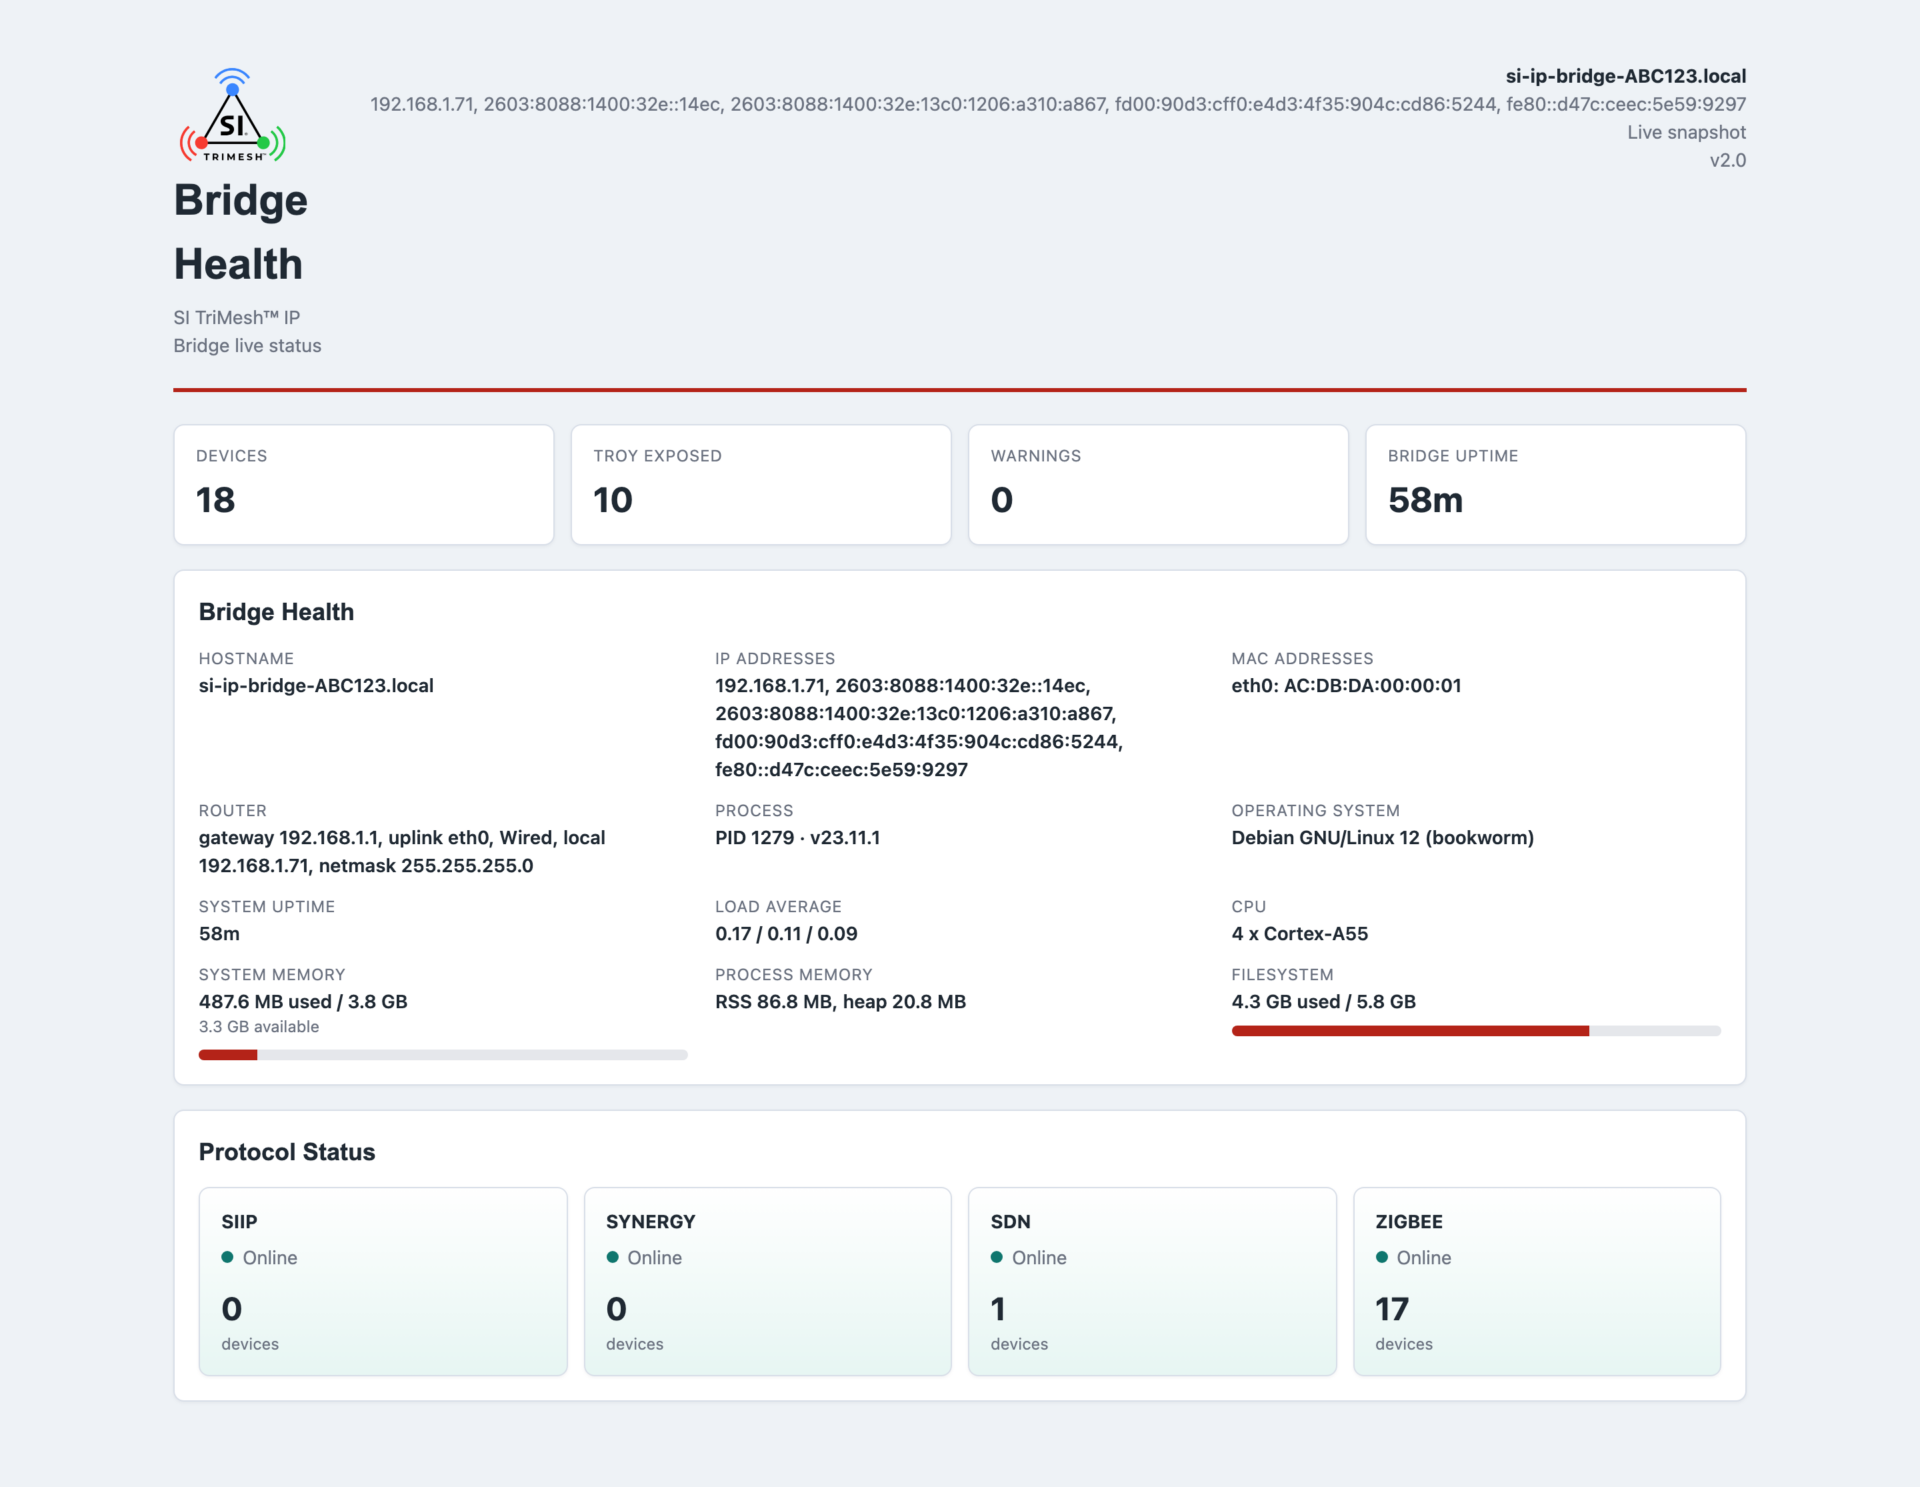
The Bridge Health page: summary tiles and the per-protocol status list.
12.2 Network Trace (Advanced view) #
Settings → Network Trace shows the raw message stream between the bridge and every device, filterable by protocol, transport (TCP, UDP, UDP broadcast, RS485, MQTT), message type (request / response / notification), device ID, and free text — with pause and Export Visible for sending a capture to SI support. This is the tool for “the motor never answered” disputes: you can watch the command leave and see whether anything comes back.
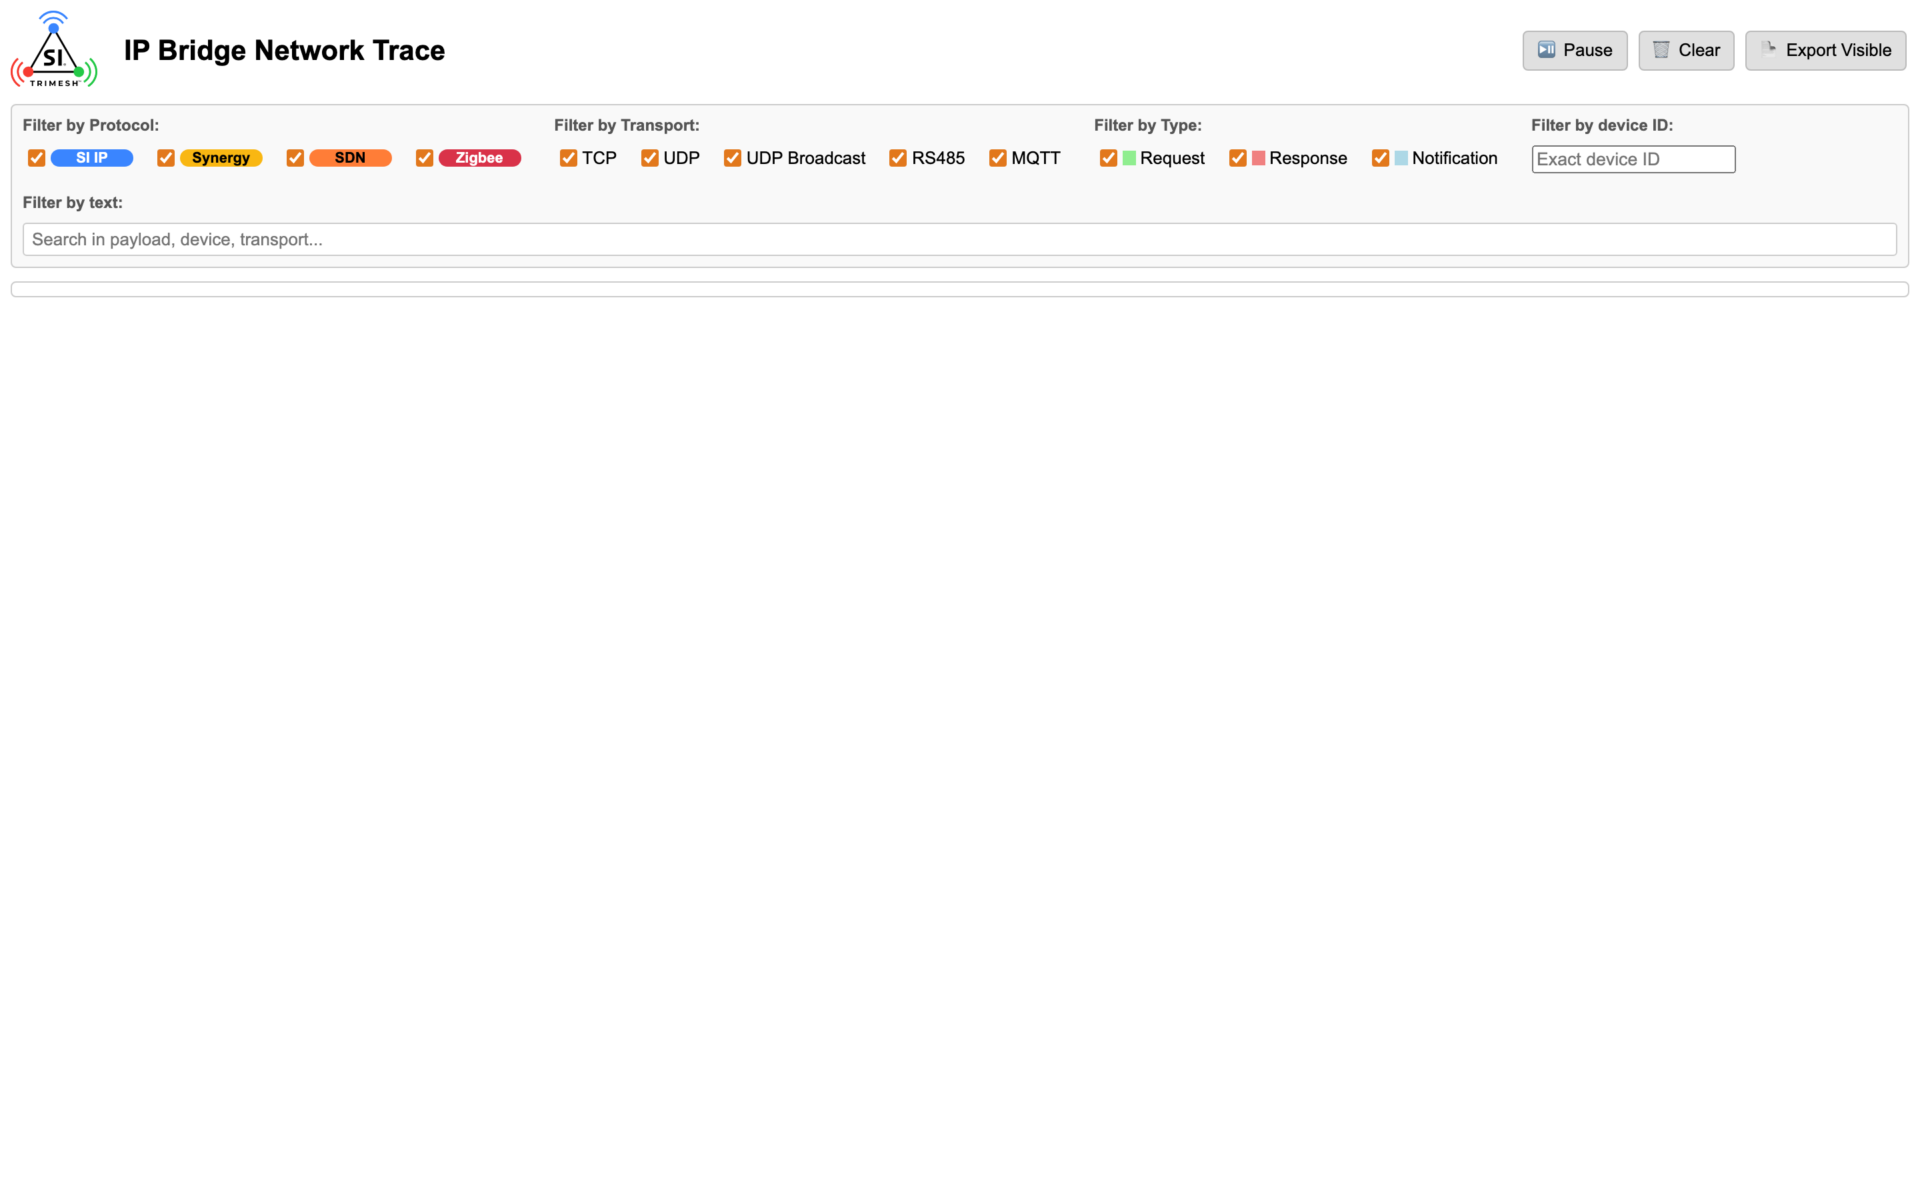
The Network Trace, showing the live message stream between the bridge and its devices.
12.3 Password Reset #
Hold the bridge’s B button for 4 seconds. This clears the web interface password; then browse to the bridge, where the account-creation page lets you set a new one. Devices, rooms, scenes, and tokens are not affected.
12.4 Restarting #
Restart Bridge (Settings) — reboots the bridge software; devices and settings are untouched.
Restart slot (Zigbee Management → Coordinators) — restarts one Zigbee network’s service.
Reboot coordinator (coordinator’s control panel) — power-cycles the coordinator hardware itself; it re-announces on the network within a couple of minutes.
12.5 Common Issues #
Symptom | Likely cause | Where to look |
|---|---|---|
Shade shows open when it is closed | Invert setting wrong for that motor | Device panel → Invert cover (section 7.2) |
Shade moves the wrong direction | Rotation direction, not Invert | Device panel → motor-specific controls (7.5) |
Device tile is greyed / “offline” | Out of range, no power, or battery depleted | Discovery → Last frame; Properties → battery/LQI; Network Map (9.6) |
New device won’t pair | Pairing window closed, or open on the wrong coordinator | Zigbee Management → Commissioning (6.2) |
Shades in a group move raggedly | Devices commanded individually, or mixed group | Use a native group (5.5, 9.4) |
Sluggish/erratic Zigbee behavior overall | 2.4 GHz interference | Channel health scan (9.2) |
Coordinator LED solid orange, never blue | Powered but no network link | Check the Ethernet/PoE cable and switch port (6.1) |
Bridge can’t find the coordinator when scanning | Coordinator offline or on another network | LED must be solid blue; same router/subnet as the bridge (6.1) |
Paired device stopped responding | Stale network address | Address repair (9.7), then re-pair as last resort |
Scene didn’t fire at sunset | Time & Location not set | Settings → Time & Location (5.9) |
Browser says connection not private | The bridge’s own certificate (expected) | Section 4.2 |
Locked out of the web interface | Lost password | B button 4 s → new password (12.3) |
“Backend communication error” banner | Bridge software restarting | Wait 1–2 min; Bridge Health; power-cycle bridge |
Install Report shows “Yes / unknown” on nearly every device | Normal for Zigbee — the bridge does not poll sleeping devices | Nothing to fix; judge by the network map instead (5.9, 9.6) |
Install Report shows a blank in the Raw LQI column | Not measured yet, or a coordinator, which has no link to itself | Nothing to fix; a present-but-low number is the one that matters (5.9) |
Not sure what a screen or a warning means | — | Ask ATEN, SI’s support assistant (12.7) |
12.6 Support Data to Collect #
Send these with the first message and you will usually skip a round of questions:
The Install Report itself, as a file (Settings → Install Report, section 5.9) — not a screenshot of it. Any of the three formats works: the HTML is the easiest to read, the JSON is the most complete, the CSV opens in a spreadsheet. SI Support can read the file directly and see the whole system at once: every device, which coordinator it is on, its link quality, its firmware, and any warnings the bridge has raised.
The bridge version, from the build line at the bottom of the left menu or the top-right of the Install Report.
A Network Trace capture of the failure, if you can make it happen on demand (12.2, Export Visible).
What you expected and what happened, on which device, and whether it has ever worked.
A note on site files. A site file (Settings → Create site file) is a different thing: it is a full configuration backup and it contains administrator and API credentials and your Zigbee network keys. Send one only if SI Support asks for it, and send it the way they ask.
12.7 Getting Help: ATEN and SI Support #
The bridge points you at ATEN from Settings → Support, and you can reach any of the following from any device.
ATEN — SI’s AI support assistant (siagent.screeninnovations.com), reachable from the bridge at Settings → Support, where its logo is the single tile on the card. ATEN is the fastest answer for anything SI makes. It is available all the time, it has read SI’s product documentation and training material, and it points you to the article or video that covers your question.
It is at its best when you give it the same detail you would give a person on the phone:
Say what you are working on and what happened, in ordinary words. “Two Zigbee shades in one room stopped answering after I changed the channel” gets a better answer than “shade not working”.
Say which product and which protocol, if you know it: TriMesh bridge, battery or PoE shade, TRO.Y, Zigbee or wired.
Quote the screen. If the bridge printed a message or a warning, paste it in exactly.
Tell it what you already tried, so it does not send you back through it.
Use it for the things that otherwise cost a phone call: what a screen or a setting does, what a warning means, the right order to do something in, which accessory or part fits, and where the relevant article or video is. If ATEN cannot resolve it, ask it to raise a support case and it will pass the conversation to the SI Support team rather than making you start again.
The SI support library (support.screeninnovations.com) is the same documentation to browse and search yourself, including the articles this manual is built from. It is a website rather than a link on the bridge — on firmware v1.2 the bridge’s Support card carries ATEN only.
The SI Support team is the escalation for anything ATEN cannot close, anything involving a return or a warranty, and anything where the answer depends on your specific order. Send the four items in 12.6 with the first message.
One thing to know about this manual and ATEN: they are kept in step. If ATEN’s answer and this manual disagree, the bridge in front of you is the tie-breaker — tell SI Support, because one of the two needs correcting.
13. Specifications #
Observed on the shipping unit:
Quad-core ARM (Cortex-A55, 64-bit), 4 GB RAM, Linux-based firmware
Wired Ethernet (RJ45); HTTPS web interface; WebSocket API
Protocols: SI IP, Synergy, SDN (RS485), Zigbee (up to 3 coordinators)
Zigbee coordinators: SONOFF Dongle-M, SMLIGHT SLZB-06 series (network-attached)
Zigbee coordinator (SONOFF Dongle-M), per the manufacturer’s published specification:
Power: 5 V / 1 A USB-C, or PoE (48 V / 0.25 A); standby draw 0.64 W
Radios: Zigbee 3.0 (Silicon Labs EFR32MG24) and 2.4 GHz Wi-Fi (ESP32-D0WDR2); high-power Zigbee output (20 dB + 5 dB antenna gain, as published)
Dimensions: 169 x 32.5 x 22 mm; wall bracket included
Operating range: -10 to 60 C, 5-95% RH
Appendix A. Glossary #
Bridge — this product; the hub between the network and the shade protocols.
Coordinator — the network-attached base station that runs one Zigbee mesh network (up to three per bridge).
Router (Zigbee) — a mains-powered Zigbee device that relays traffic and extends range (plugs, wired motors).
End device — a battery Zigbee device that sleeps between messages (battery motors, sensors, remotes).
Pairing / commissioning — adopting a new device into a network and preparing it for use.
Interview — the bridge learning a newly paired device’s capabilities.
LQI — link quality indicator (0–255); higher is a stronger Zigbee link.
Group — devices addressed as one at the protocol level; members act simultaneously.
Scene — a stored list of actions that runs from one tile or trigger.
Saved position — a preset stop stored inside a motor.
Invert — per-motor setting that flips which end of 0–100 means open.
Limits — a motor’s stored end-of-travel boundaries.
OTA — over-the-air firmware update for Zigbee devices.
Binding (Zigbee) — a direct remote-to-device link that works without the bridge.
UID — a device’s stable identifier used by the API (e.g.,
zigbee-0xabc).
Version 1.2, 2026-09-21. Every screen name, button and workflow in this manual was verified against a running bridge on firmware v1.2, its built-in API documentation, and live installations. The install-report detail in section 5.9 was verified against four real v1.2 exports.